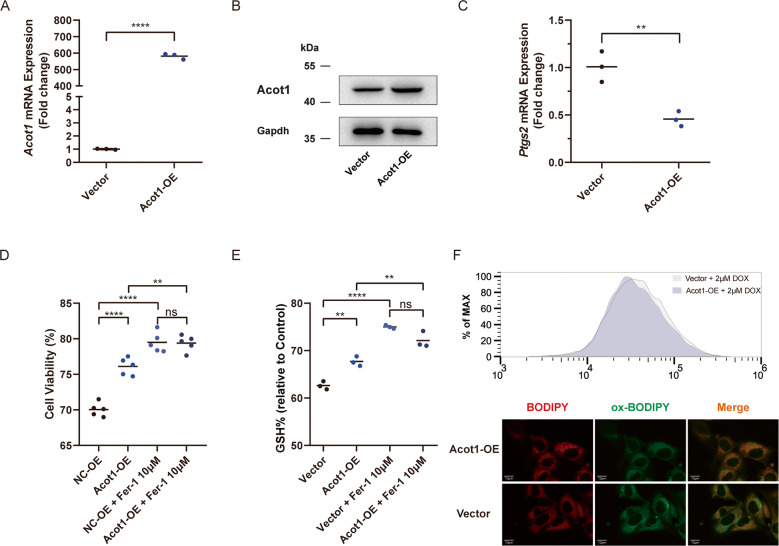
Fig. 6. Acot1 overexpression inhibits lipid peroxidation and DOX cytotoxicity.
a Realtime-qPCR confirming the efficiency of Acot1-OE plasmid comparing with vector control. b Western blot confirming the efficiency of Acot1-OE plasmid comparing with vector control. c Ptgs2 mRNA level in DOX (2 μM, 24 h) treated HL-1 cells transfected with Acot1-OE and vector. d Cell viability analysis showing the effect of Acot1 overexpression in DOX (2 μM, 24 h) induced cell death and the protective effect of Fer-1 (10 μM) co-treatment. e The intracellular GSH/GSSG levels showing the effect of DOX (2 μM, 6 h) treated HL-1 cells with or without Acot1 overexpression and the protective effect of Fer-1 (10 μM) co-treatment. f Flow cytometer analysis of C11-BODIPY 581/591 staining showing lipid peroxidation level in DOX (2 μM, 6 h) treated HL-1 cells with or without Acot1 overexpression and the representative fluorescent images showing lipid peroxidation level. Significance in a, c was calculated using the unpaired Student’s t test. Significance in d, e was calculated using the one-way ANOVA test with multiple comparisons between the two groups. P value < 0.05 was considered to be significant, and labeled as **P < 0.01; ****P < 0.001; ns not significant.

