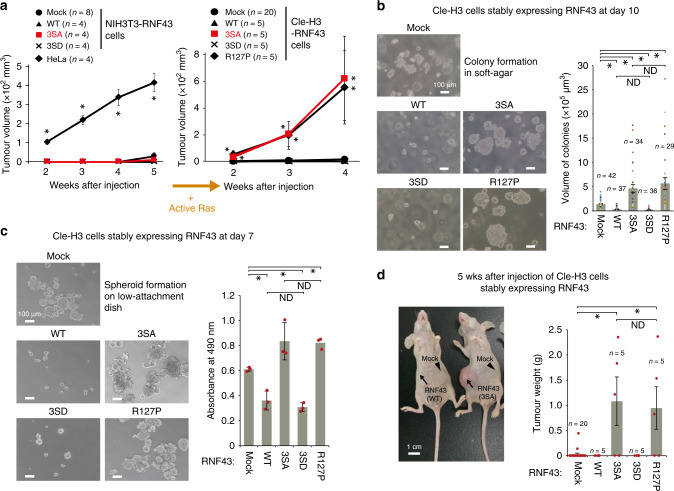
Fig. 4. Active Ras cooperates with mutant RNF43 to induce tumorigenesis.
a Time-dependent tumour growth was examined in nude mice following expression of RNF43 phospho-mutant forms in NIH3T3 and Cle-H3 cells. Estimated tumour volume is shown. Red lines indicate RNF43(3SA)-expressing tumours. b Anchorage-independent colony-forming activity was evaluated via soft agar assay following the expression of RNF43 phospho-mutant forms in Cle-H3 cells. Scale bars, 100 μm. c Spheroid-forming activity was examined in Cle-H3 cells expressing RNF43 mutant forms. Spheroid formation was quantified via MTS assay. d Image of nude mice injected with Cle-H3-RNF43 cells. Scale bars, 1 cm. Tumour weight was measured at 5 wks following Cle-H3 injection. Graphs and error bars in this figure represent mean ± sd (c) or ± standard error of the mean (sem) (a, b, d) of independent experiments or samples. Red circles indicate individual values of each sample b–d). The P values for the indicated comparisons in this figure were determined by one-way ANOVA (P < 0.05). n = 4–20 (a), n = 29–42 (b), n = 3 (c), n = 5–20 (d) biologically independent samples. Asterisks or ND indicates significant or no significant difference in indicated comparisons, respectively.

