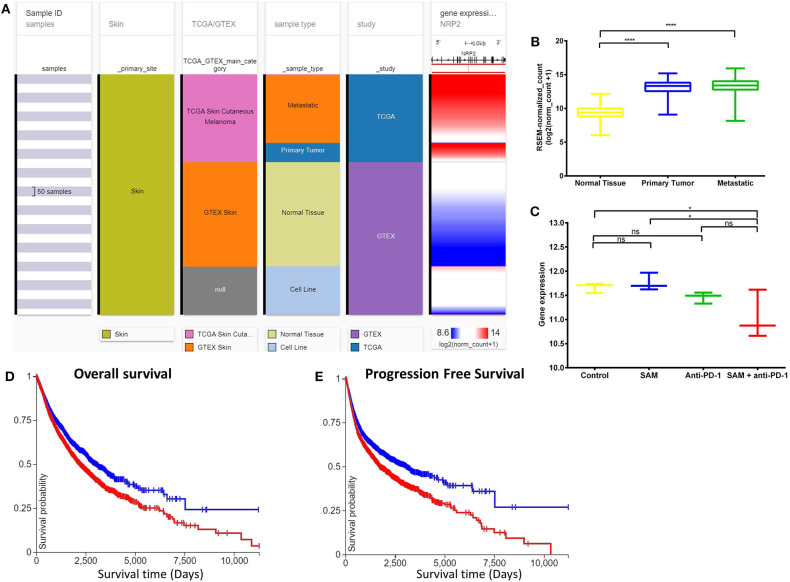
Figure 4.
Analysis of NRP2 gene expression in clinical public data. (A) Expression of NRP2 gene in human healthy and skin cutaneous melanoma patients of GTEx and TCGA databases, respectively. The columns show various phenotypic categories applied to stratify samples according to Sample Id, Skin (true), TCGA/GTEX, sample type (normal tissue, primary tumor, metastatic tissue, or cell line), and study. The last column shows gene expression of NRP2 of samples stratified according to the previous columns. Each row contains data from a single sample. (B) The expression data of NRP2 in the normal tissue, primary tumor, and metastatic tissue samples in (A) have been plotted in a box-plot graph (n = 1,024 samples). Expression values are in RSEM (RNA-Seq by expectation maximization). (C) The expression data of Nrp2 from RNA-sequencing of the primary B16 tumors after treatment with SAM, Anti-PD-1, and combination in this study (n = 12; 3/group). Expression values are DeSEq2 normalized counts. (D,E) Overall survival and progression-free survival Kaplan-Meier curves of NRP2 from RNA-seq of GTEx and TCGA databases; X-axis: survival time (days); Y-axis: survival probability. (D) Low (blue) n = 4,504; High (red) n = 5,930; P = ****. (E) Low (blue) n = 4,346; High (red) n = 5,926; P = ****. Statistical significance was obtained by ANOVA in GraphPad prism and are represented by asterisks (ns, not significant; *P < 0.05 and ****P < 0.0001). All the data and figures, except (C), were generated using The UCSC Xena platform (44).

