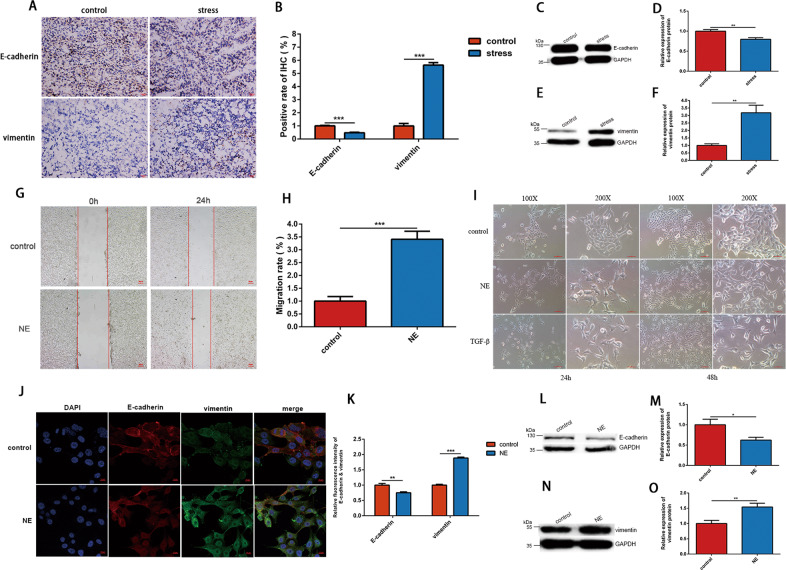
Fig. 2. Chronic stress and NE induced EMT of 4T1 cells in vivo and in vitro.
a, b Representative images of immunohistochemical staining of E-cadherin and vimentin protein in tumors from control and stress group (n = 3). The fluorescence intensity was quantified and shown in histogram. c–f Western blot was used to analyze the expression level of E-cadherin and vimentin protein in tumors from control and stress group (n = 3). The intensity of the bands for E-cadherin and vimentin was normalized to GAPDH and shown in histograms. g, h 4T1 cells treated with 10 μM NE showed a significantly accelerated migration speed compared with the control cells treated with normal saline (NS) in wound healing assay (n = 3). The migration rate of the two groups are shown in histogram. i 4T1 cells were treated with NS, 10 μM NE or 5 ng/ml TGF-β and changes in cell morphology were observed under light microscopy (n = 3). Representative optical fields form different groups are shown. j, k 4T1 cells were treated with NS or 10 μM NE for 48 h, and the EMT-related protein were detected by immunofluorescent staining (n = 3). E-cadherin and vimentin are shown in red and green, respectively, while cell nucleus is shown in blue. The fluorescence intensity was quantified and shown in histogram. l–o 4T1 cells were cultured with NS or 10 μM NE for 48 h. The expression level of E-cadherin and vimentin protein were then detected by western blot (n = 3). The intensity of the bands for E-cadherin and vimentin was normalized to GAPDH and shown in histograms. Data are shown as the mean ± SD; *P < 0.05; **P < 0.01; ***P < 0.001.

