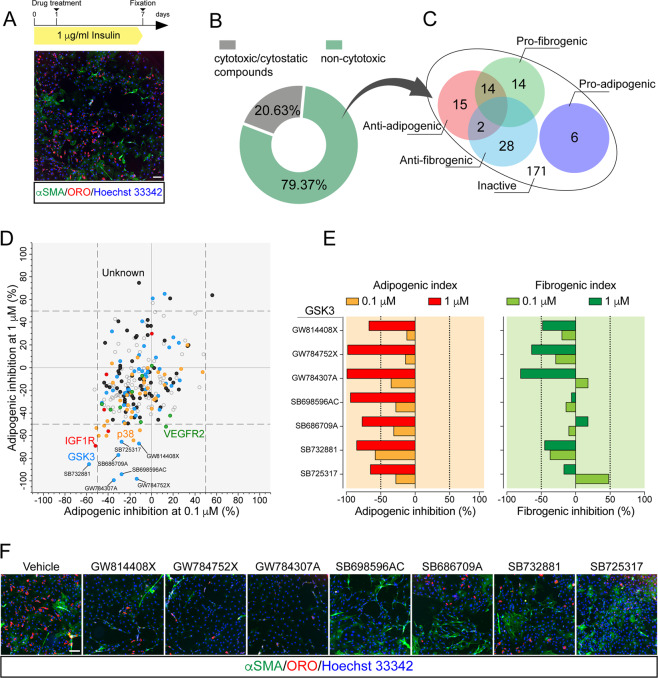
Fig. 1. GSK inhibitors affect the differentiation potential of FAPs.
a Experimental plan to screen the PKI library. Representative vehicle-treated sample (10× magnification, scale bar: 100 μm) showing spontaneous differentiation of FAPs into adipocytes (red, ORO staining) and myofibroblasts (green, stained with anti-αSMA antibody). b Screening compounds were classified as safe or cytotoxic/cytostatic. Cytotoxic/cytostatic compounds were defined for their capability to reduce by more than 30% the number of Hoechst 33342-positive nuclei at the end of the assay. c Venn diagrams summarizing the number and class of hits. d Scatter plot representing the inhibition of adipogenesis of the safe compounds at the two tested concentrations (0.1 and 1 μM). Dashed vertical and horizontal lines indicate the cutoff used to define a “hit” (±50% of the effect vs. DMSO). KIs targeting the same kinase are labeled with the same color. e Bar plot representing the percentage of adipogenic (left) and myofibrogenic (right) inhibition for the active compounds targeting GSK3. Dashed vertical lines indicate the cutoff for hit selection. f Representative immunofluorescence images (10× magnification, scale bar: 100 μm) showing FAP adipogenesis and myofibrogenesis upon treatment with GSK3-targeting compounds. Nuclei (blue) were revealed using Hoechst 33342.

