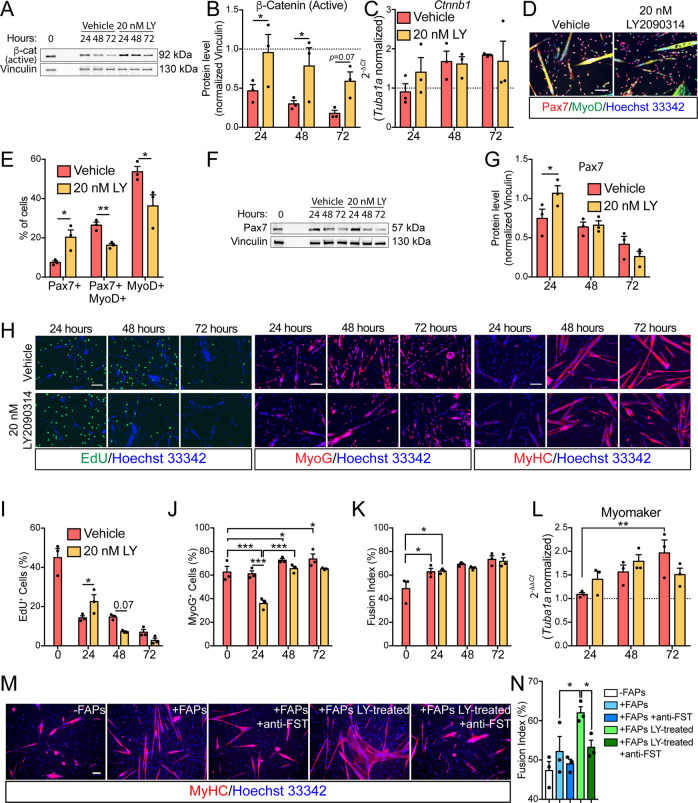
Fig. 4. GSK3 inhibition promotes MuSC self-renewal and boosts the promyogenic ability of FAPs.
a Representative immunoblot showing the protein level of non-phospho (active) β-catenin and vinculin (n = 3) in MuSCs undergoing spontaneous myogenic differentiation in the presence of vehicle or 20 nM LY2090314. b Bar plot showing the densitometric analysis for non-phospho (active) β-catenin normalized over vinculin. c Quantitative PCR (qPCR) for Ctnnb1 in MuSCs undergoing spontaneous myogenic differentiation in the presence of vehicle or 20 nM LY2090314 (n = 3). The statistical significance was estimated by One-way ANOVA. d Representative Pax7/MyoD immunostaining (20× magnification; scale bar, 100 μm) in MuSCs after 24 h of culturing in the presence of vehicle or 20 nM LY2090314 (n = 3). e Bar plot showing the ratio of Pax7-, Pax7/MyoD-, and MyoD-positive cells. The statistical significance was estimated by two-way ANOVA. f Representative immunoblot showing the protein level of Pax7 in MuSCs undergoing spontaneous myogenic differentiation (n = 3). g Bar plot showing the densitometric values of Pax7 over vinculin. The statistical significance was estimated by two-way ANOVA. h Representative EdU labelling (left panel, 20× magnification; scale bar, 100 μm) in MuSCs undergoing spontaneous myogenic differentiation in the presence of vehicle or 20 nM LY2090314 (n = 3). Representative immunostaining against MyoG (central panel, 20× magnification; scale bar, 100 μm) in MuSCs undergoing spontaneous myogenic differentiation in the presence of vehicle or 20 nM LY2090314 (n = 3). Representative immunostaining against MyHC (left panel, 20× magnification; scale bar, 100 μm) in MuSCs undergoing spontaneous myogenic differentiation in the presence of vehicle or 20 nM LY2090314 (n = 3). Nuclei (blue) were revealed using Hoechst 33342. i Bar plot reporting the ratio of EdU-positive MuSCs. The statistical significance was estimated by two-way ANOVA. j Bar plot reporting the ratio of MyoG-positive MuSCs. The statistical significance was estimated by two-way ANOVA. k Bar plot reporting the percentage of fusion index of MuSCs-derived myotubes. The statistical significance was estimated by two-way ANOVA. l Quantitative PCR (qPCR) for Myomaker in MuSCs undergoing spontaneous myogenic differentiation in the presence of vehicle or 20 nM LY2090314 (n = 3). The statistical significance was estimated by One-way ANOVA. m Representative MyHC immunostaining (red, 20× magnification; scale bar, 100 μm) in MuSCs undergoing spontaneous myogenic differentiation in the presence of FAPs treated/untreated with 20 nM LY2090314 in the presence/absence of neutralizing anti-Follistatin antibodies (n = 3). n Bar plot reporting the percentage of fusion index of MuSCs-derived myotubes in each condition. The statistical significance was estimated by two-way ANOVA. Nuclei (blue) were revealed using Hoechst 33342. All data are represented as mean ± SEM and the statistical significance is defined as *p < 0.05; **p < 0.01; ***p < 0.001.

