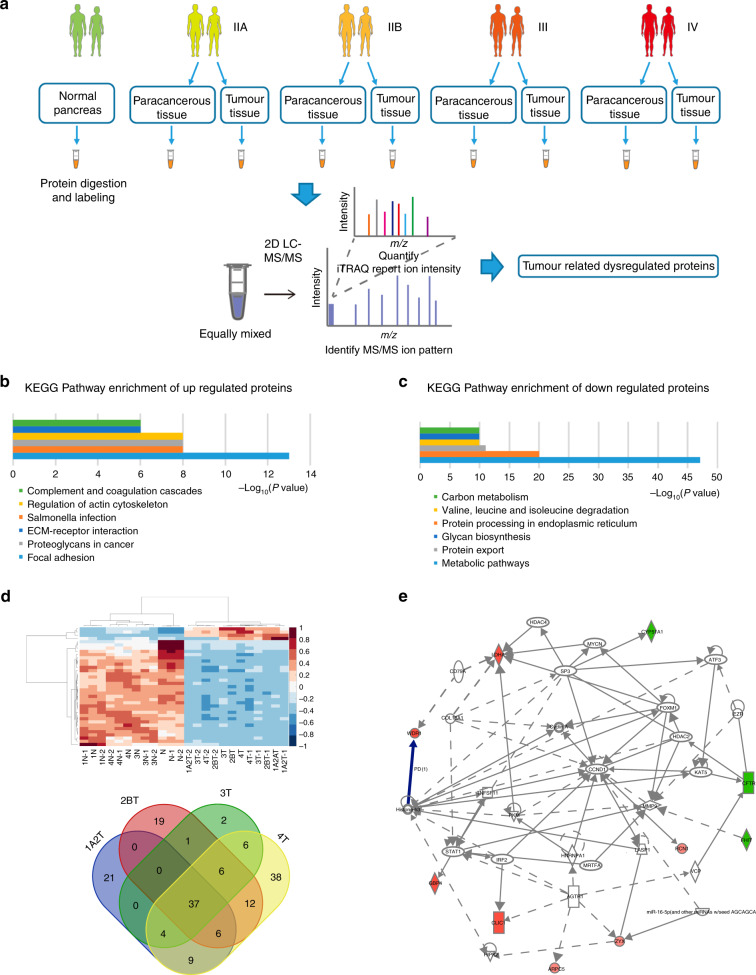
Fig. 1. The differentially expressed proteins identified by iTRAQ–2DLC–MS/MS.
a Flowchart of the experimental set-up. Fresh PDAC and the corresponding normal tissue samples were harvested from newly diagnosed PDAC patients. Samples were pooled and subsequently identified by mass spectrometry, and data were then normalised for subsequent data analysis. b Gene ontology analysis of differentially expressed proteins with fold change ≥1.2 and P value ≤ 0.05. c Gene ontology analysis of differentially expressed proteins with fold change < 1.2 and P value ≤ 0.05. d Heatmap and Venn diagram showing the 37 upregulated or downregulated proteins across all stages of PDAC tissues. e IPA analysis showed that the 10 differentially expressed proteins were involved in tumorigenesis. Selected upregulated proteins are marked in red and downregulated proteins are marked in green.

