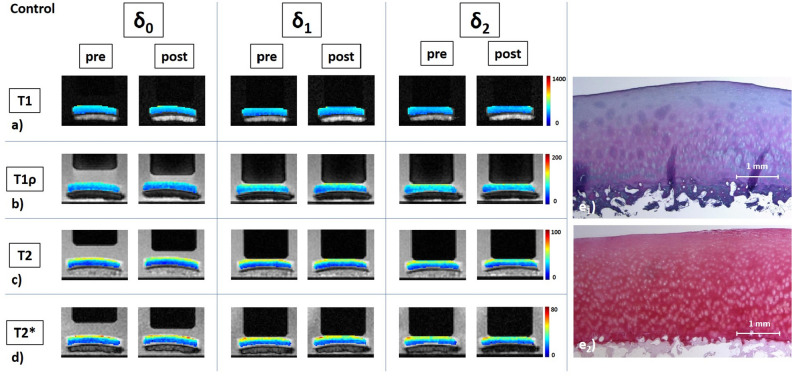
Figure 1.
Details of a control cartilage sample and its response to loading as assessed by serial quantitative MR images as a function of loading intensity. Serially acquired T1 (a), T1ρ (b), T2 (c), and T2* (d) maps of a representative control sample before (pre) and after (post) subjection to incubation under standardized conditions (37 °C, 5% CO2, and 21% O2) without additional trypsin exposure. Loading intensity was controlled by set pressure levels and measurements were made in the unloaded configuration (δ0) and under loading to 15.1 N (δ1) and 28.6 N (δ2). Segmented color-coded relaxation maps were overlaid onto the corresponding morphological images. Unit of color codes on the right is [ms]. Of note, the loading piston’s diameter is 10 mm. Corresponding histological sections of the cartilage sample after Hematoxylin and eosin (e1) and Safranin O (e2) staining indicate structural and compositional integrity of the sample. More specifically, the tissue surface and tidemark were intact, while cellularity and Safranin-O staining intensity were regular.

