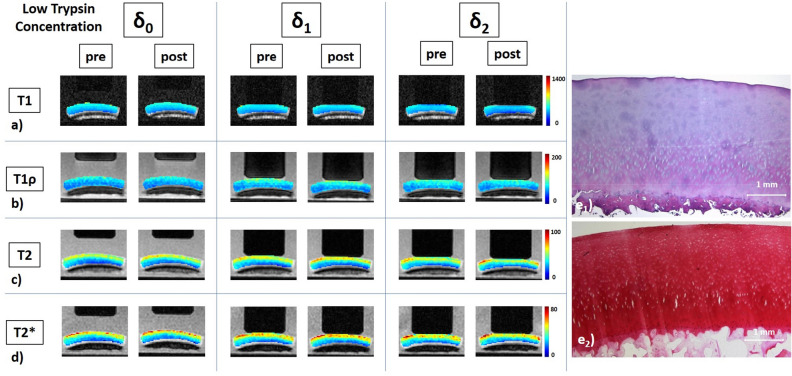
Figure 2.
Details of a low-concentration trypsin-treated cartilage sample, its response to loading, and corresponding histological sections. Serial quantitative T1 (a), T1ρ (b), T2 (c), and T2* (d) maps as well as corresponding histological sections (e) of a representative sample before and after exposure to low concentration of trypsin at 0.1 mg/mL for 2 h. Histological assessment revealed intact tissue surface and tidemark as well as regular cellularity (e1), but superficial Safranin-O de-staining indicative of proteoglycan depletion that was limited to the superficial tissue zone (e2). Otherwise, image details as in Fig. 1.

