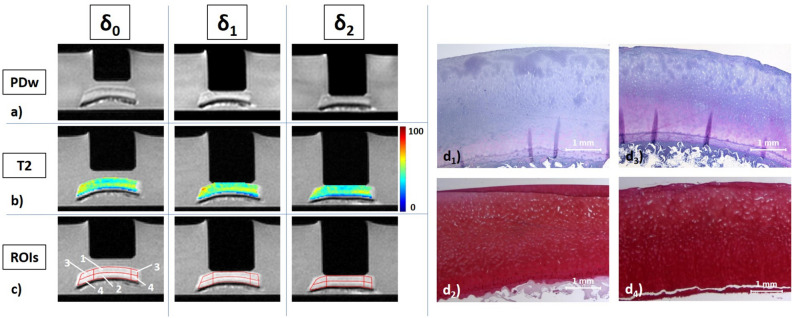
Figure 5.
Details of image analysis, post processing, and histological referencing. (a) Mid-sagittal Proton Density-weighted images of a representative cartilage sample subject to increasing loading intensity, i.e. at the unloaded configuration (δ0) and under loading to 15.1 N (δ1), and 28.6 N (δ2). (b) Corresponding T2 maps overlaid onto the respective morphological images (TE 41.9 ms). Unit of scale on the right is [ms]. (c) Regional and zonal ROIs were defined as the upper and lower sample halves as well as the sub-pistonal (SPA) and peri-pistonal area (PPA). Consequently, seven ROIs were evaluated: (1) SPAupper, (2) SPAlower, (3) PPAupper, (4) PPAlower, (5) SPA full thickness (1 + 2), (6) PPA full thickness (3 + 4), (7) entire cartilage sample (ECS = 1 + 2 + 3 + 4). (d) Corresponding histological sections, stained with hematoxylin/eosin (d1,d3) and Safranin O (d2,d4), of the cartilage sample following incubation without enzyme exposure and pre- and post-exposure measurements (d1,d2) and of the adjacent cartilage tissue at the time of sample preparation (d3,d4). Same cartilage sample as in Fig. 4 (control).

