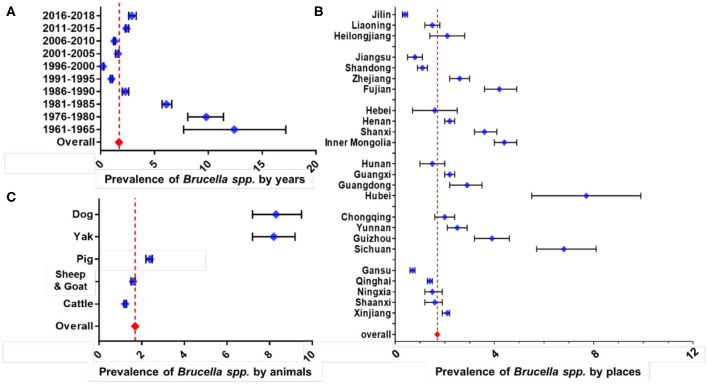
Figure 5.
Results of subgroup meta-analysis for different animal-related factors. Subgroup analysis on sampling year (A), subgroup analysis on the province (B), and subgroup analysis on the host (C). The broken vertical line indicates the pooled summary estimate of prevalence for the selected variable.

