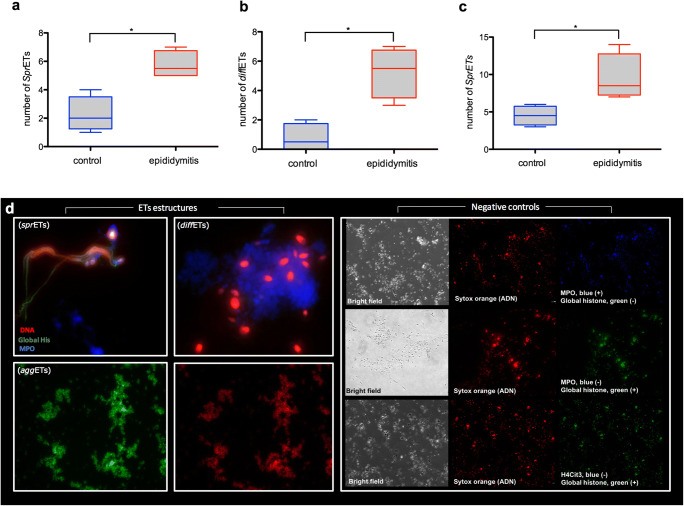
Fig. 1.
Microscope epifluorescence images showing the different phenotypes of ET structures (sprETs, diffETs, aggETs) in semen samples from epididymitis patients: DNA (red stain, Sytox Orange); MPO (blue stain, Alexa Fluor 405); global histones (green stain, Alexa Fluor 488) and negative controls of immunofluorescences. Graphs a, b, and c are box plot with median and interquartile range differences of quantification of the different phenotypes of ETs represented in the images comparing semen samples from epididymitis patients and control group. *P < 0.05

