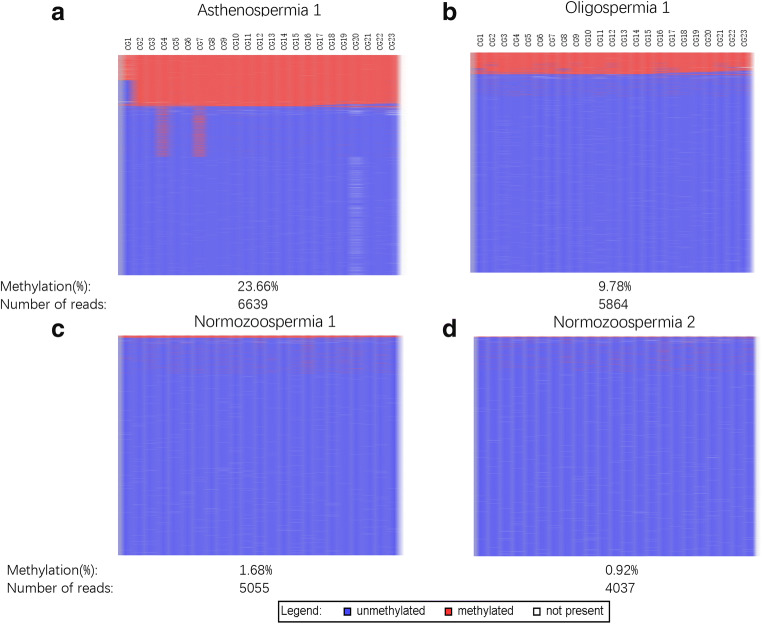
Fig. 3.
Methylation analyses of GNAS XL DMR of BSAS of two normal controls (top a and b) and two semen samples from asthenospermic group (c) and oligoasthenospermic group (d). Mean methylation levels and number of reads are given below each pattern. Lines represent reads; columns represent CpG dinucleotides; blue squares represent unmethylated CpGs; red squares represent methylated CpGs; white squares represent missing sequence information

