
Figure 2.
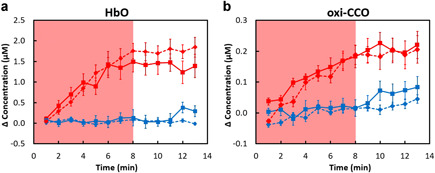
Comparison of concentration changes of (a) Δ[HbO] and (b) Δ[oxi‐CCO] measured from two groups of young adults in the current (solid lines; n = 15) and previous (dashed lines; n = 11) study. The red symbols and lines indicate the results from the tPBM experiment, while the blue symbols and lines indicate those from the sham experiment. The error bars are standard errors of mean. The shades indicate the time durations of tPBM/sham illumination. No significant differences between the two young‐adult groups (solid lines: current study; dashed lines: previous study) are marked with * P < 0.05 for tPBM and sham condition respectively. [HbO], oxygenated hemoglobin; [oxi‐CCO], oxidized‐state cytochrome c oxidase.