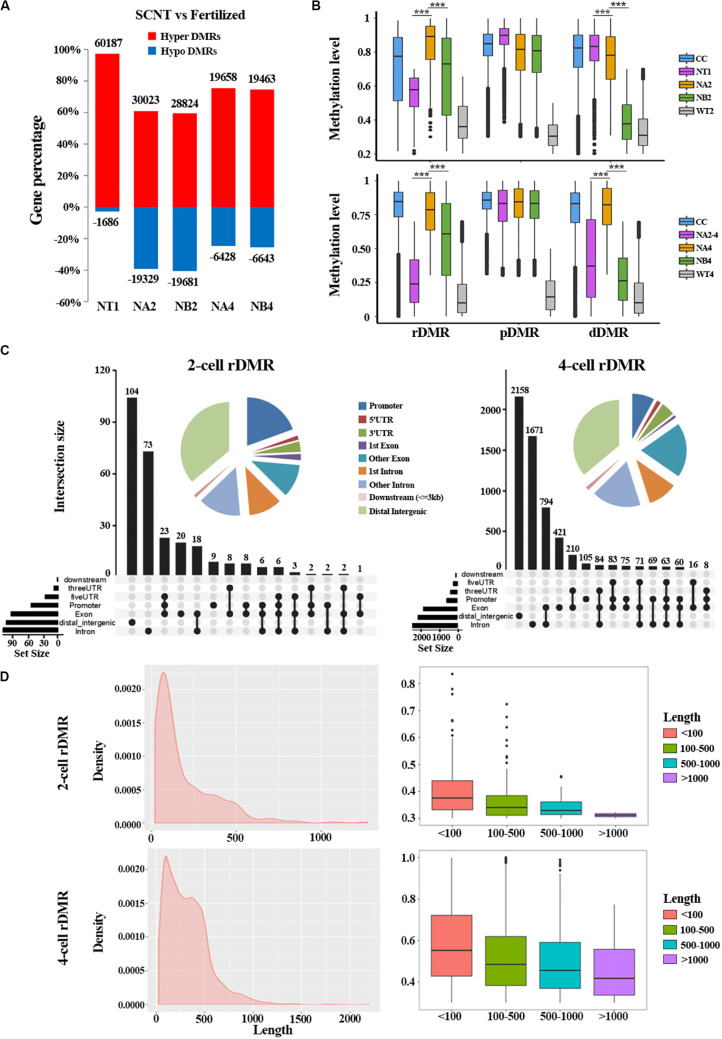
FIGURE 2.
Aberrant DNA methylation patterns revealed by differential DNA methylation region analysis in SCNT embryos. (A) Barplot of DMRs in the SCNT and in vivo fertilized samples at different developmental stages. The red and blue bars represent hyper-DMRs and hypo-DMRs, respectively. (B) Boxplot of hyper DMRs in SCNT and in vivo fertilized embryos. Each box represents a hyper DMR, and colors represent different types of embryos at different development stage. DMRs were classified into three categories: dDMRs (de-methylated differential methylated regions); rDMR (re-methylated differential methylated regions); and pDMR (persistent differential methylated regions). Differences are statistically significant. *P-value < 0.05; **P-value < 0.01; ***P-value < 0.001, t-test. (C) Genomic distribution of rDMRs. Pie charts represent proportion of rDMRs in different genomic contexts. Inset graphs represent number of DMRs distributed in single or combined genomic regions. (D) Probability density distribution of rDMRs in 2-cell and 4-cell stage (left). Box plots show change in DNA methylation level within different length of rDMRs (right panel, less than 100 bp, between 100 and 500 bp, between 500 and 1000 bp, and greater than 1000 bp).

