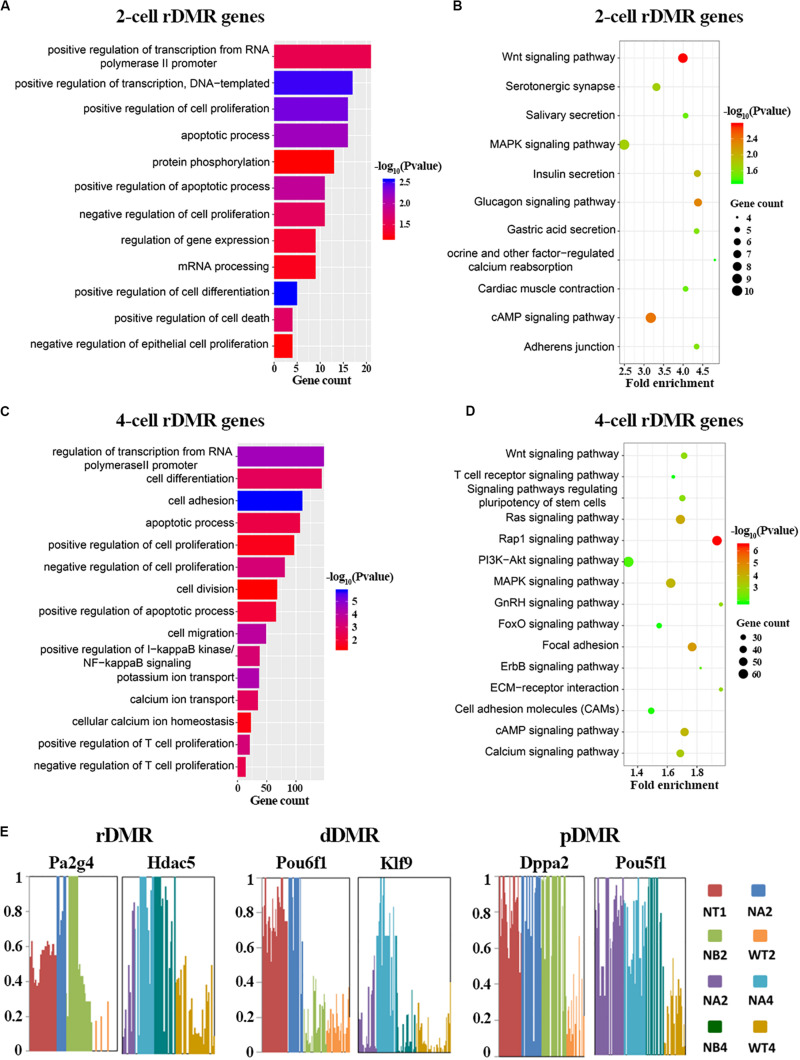
FIGURE 3.
Functional analysis of rDMRs. (A,C) GO term analysis of rDMRs in 2-cell stage and 4-cell stage, respectively. (B,D) KEGG pathway enrichment of rDMRs in 2-cell stage and 4-cell stage, respectively. (E) Examples of genes with different DMR patterns. Different samples were represented by different bar colors. Ordinate represents DNA methylation level.

