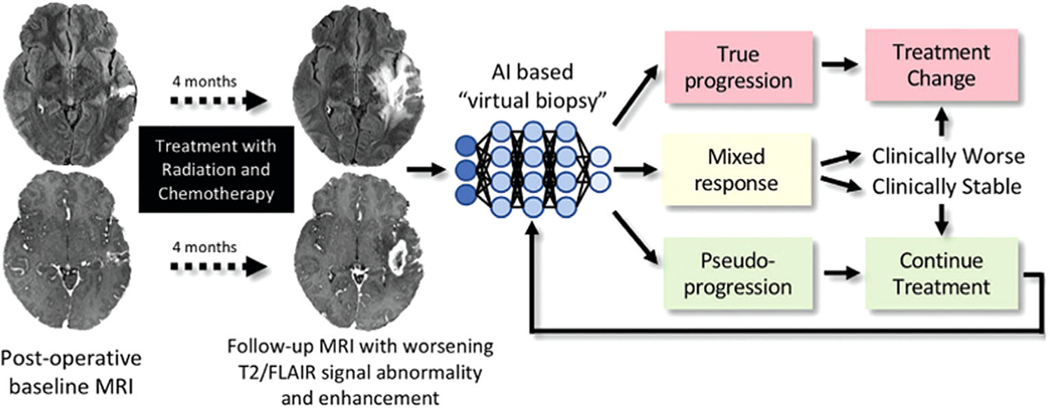
FIGURE 13:
Treatment response in neuro-oncologic imaging. After standard-of-care treatment with combined radiation therapy and chemotherapy, increasing T2 FLAIR signal intensity abnormality and new and/or increasing size of enhancing lesions are often seen. AI-based “virtual biopsy” could assist in distinguishing underlying biology and segregating treatment response into three possible categories: true progression (>75% recurrent and/or residual glioma at pathologic examination), mixed response (25–75% recurrent and/or residual glioma at pathologic examination), and pseudoprogression (>75% treatment-related changes). Categories dictate distinct therapeutic approaches. In this example, the new enhancing lesion was found to represent 100% of treatment-related changes at pathologic examination, with few atypical cells. Reprinted with permission from Ref. 100 (Rudie et al., Radiology 2019 Mar; 290 (3):607–618).

