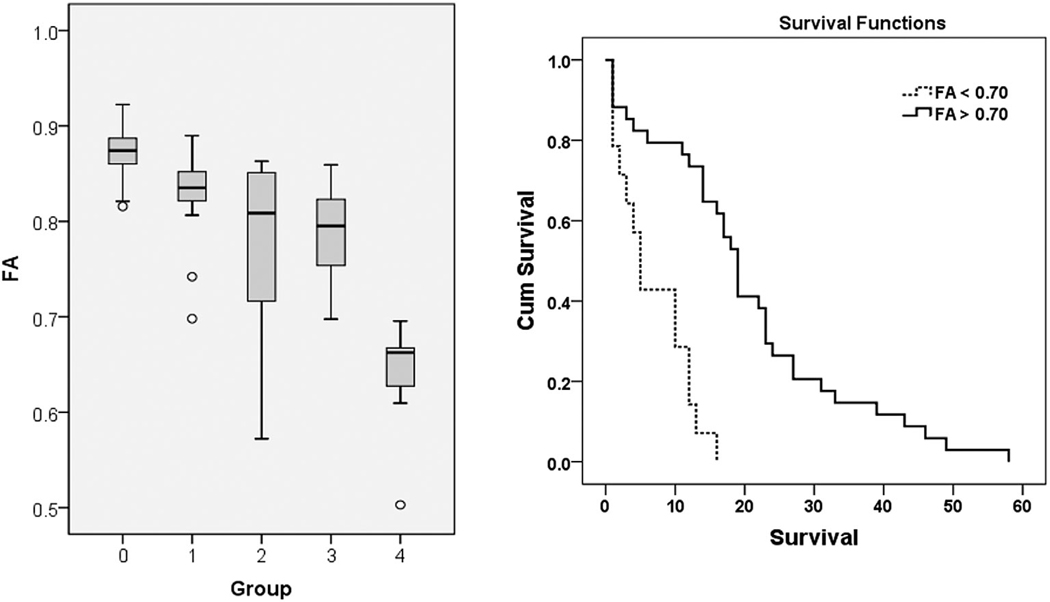
FIGURE 3:
Left panel: Boxplot of FA from the corpus callosum (CC) in GBM patients with short and long survival. The solid line inside the box represents the median value, while the edges represent the 25th and 75th percentiles. Straight line (bars) on each box indicates the range of data distribution. Circles represent outliers (values more than 1.5 box length from the 75th/25th percentile). 0. Control group.1. Long survivors without CC invasion. 2. Short survivors without CC invasion. 3. Long survivors with CC invasion. 4. Short survivors with CC invasion. Comparison between groups 1 and 2 (P = 0.14), groups 2 and 3 (P = 0.95) did not reach a significant difference. There were significant differences between all other groups (P < 0.05). Right panel: The ROC curve demonstrates that the FA value from the CC is the best predictor for overall survival, with an AUC of 0.77, sensitivity 1, specificity 0.59 using a cutoff value of 0.70). Reprinted with permission from Ref, 39 (Mohan et al., Eur J Radiol 2019 Mar; 112:106–111).

