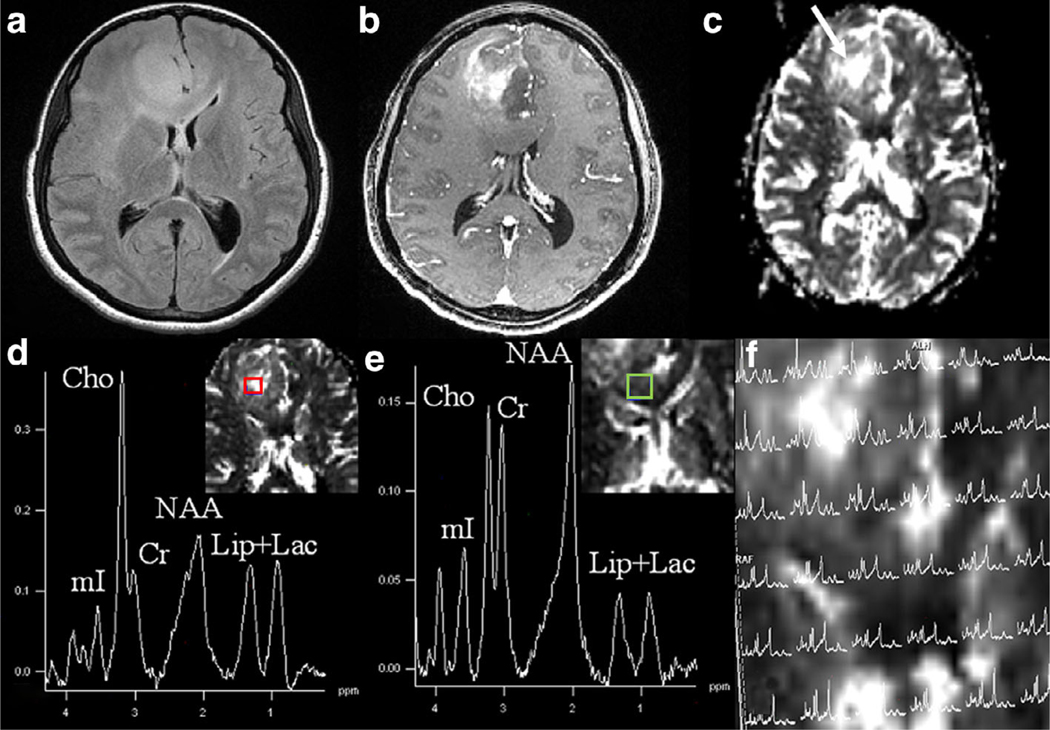
FIGURE 5:
Axial T2-FLAIR image (a) demonstrating an ill-defined hyperintense and expansile mass in the right frontal region extending into the genu of CC. There is heterogeneous contrast enhancement within the mass on the corresponding postcontrast T1-weighted image (b). A DSC-derived CBV map (c) shows high CBV within the mass. Proton MR spectra (d,e) from a voxel encompassing a high CBV region (red color) and from a voxel encompassing a low CBV region (green color) are exhibiting various metabolites. Please note the presence of high Cho levels from a high CBV region within the neoplasm, suggesting regions of high vascularity are associated with increased cellular proliferation. 1H MRS grid overlaid on CBV map (e) showing spectra from different regions of neoplasm. On histopathology (not shown), this mass showed areas of high cellularity, pseudopalisading necrosis, and endothelial proliferation consistent with anaplastic astrocytoma (WHO grade III).

