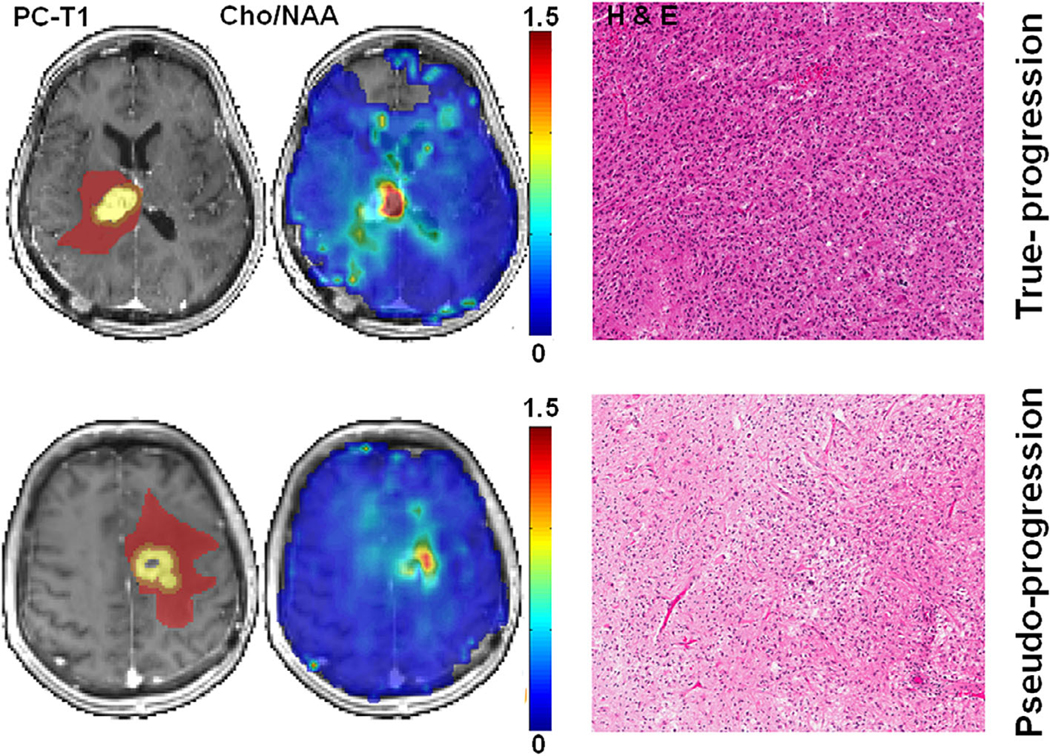
FIGURE 6:

Top row: axial postcontrast T1-weighted image from a patient with TP, demonstrating a neoplasm in the right thalamus infiltrating into the lateral ventricles. The ROIs are overlaid on the image, with the colors indicating the following defined regions: yellow, CER; orange, IPR; brown, DPR. The corresponding Cho/NAA map shows areas of elevated Cho/NAA (color bar indicating the distribution of nonnormalized Cho/NAA). A photomicrograph of a histologic section (hematoxylin-eosin stain) shows zones of high tumor cellularity, necrosis, and vascular proliferation. Bottom row: axial postcontrast T1-weighted image from a patient with PsP, demonstrating a neoplasm in the left frontal lobe. The different ROIs as defined above, are overlaid on the image. The corresponding Cho/NAA map shows reduced Cho/NAA compared with that of the TP case shown above. A photomicrograph of hematoxylin-eosin stain reveals most of the tissue with treatment-related changes, including extensive geographic necrosis and vascular fibrinoid necrosis. Reprinted with permission from Ref. 62 (Verma et al., NMR Biomed 2019 Feb; 32 (2): e4042).
