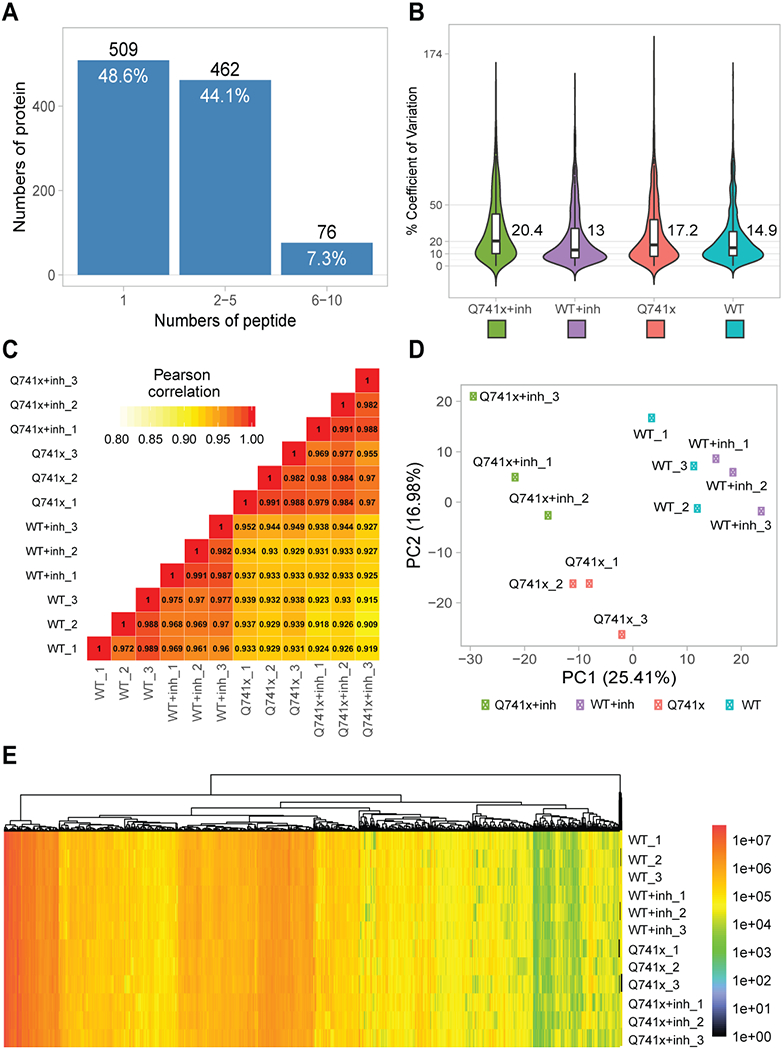
Figure 1.

Quality control steps utilized to check the overall validity of SWATH data set: (a) Total proteins identified and quantified based on the indicated number of corresponding peptides; (b) Coefficient of variation for quantitative reproducibility as violin plots; (c) Pearson correlation coefficient (r) for three independent biological replicates; (d) Principal Component Analysis (PCA) plot showing the overall clustering of the each experimental groups; (e) A single heat map of all the identified and quantified proteins to show nominal missing values at only 0.06%.
