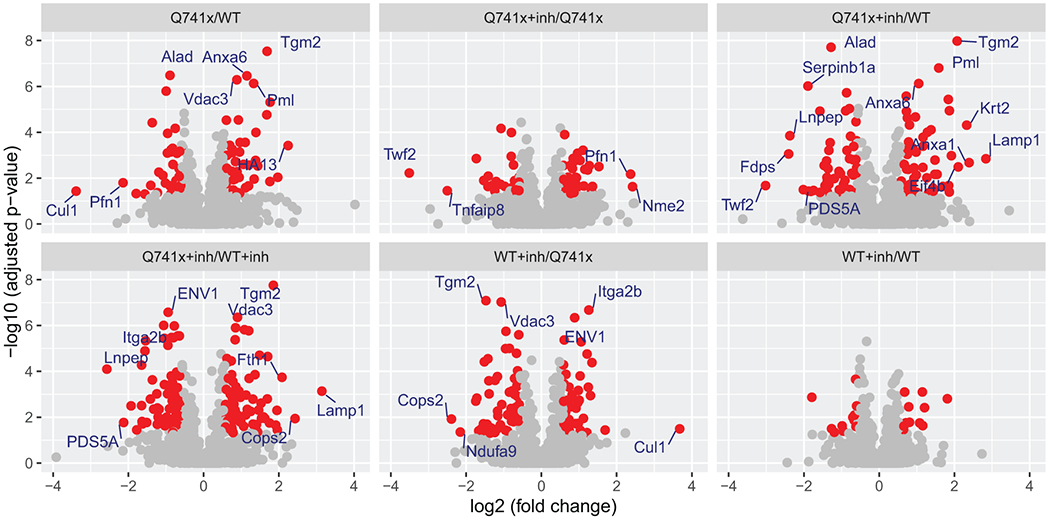
Figure 2.

Volcano plot analysis of pair wise quantitative comparisons across the different experimental groups to identify the significant changes in protein expression after ibrutinib treatment and G-CSF induction. The analysis used the 3 independent replicates data set for each group: WT, Q741x, WT+inh, and Q741x+inh. Significant proteins (>=2 fold change) are labeled in the volcano plot and their expression related details are provided with supplementary table 1. The red colored dots in the volcano plot indicate the proteins with 1.5-fold changes with adjusted p-value < 0.05. The WT+inh/WT group does not display any significant proteins reflecting that ibrutinib is not sensitivity towards the normal proteome of WT-GCSFR signaling.
