
Fig. 2.
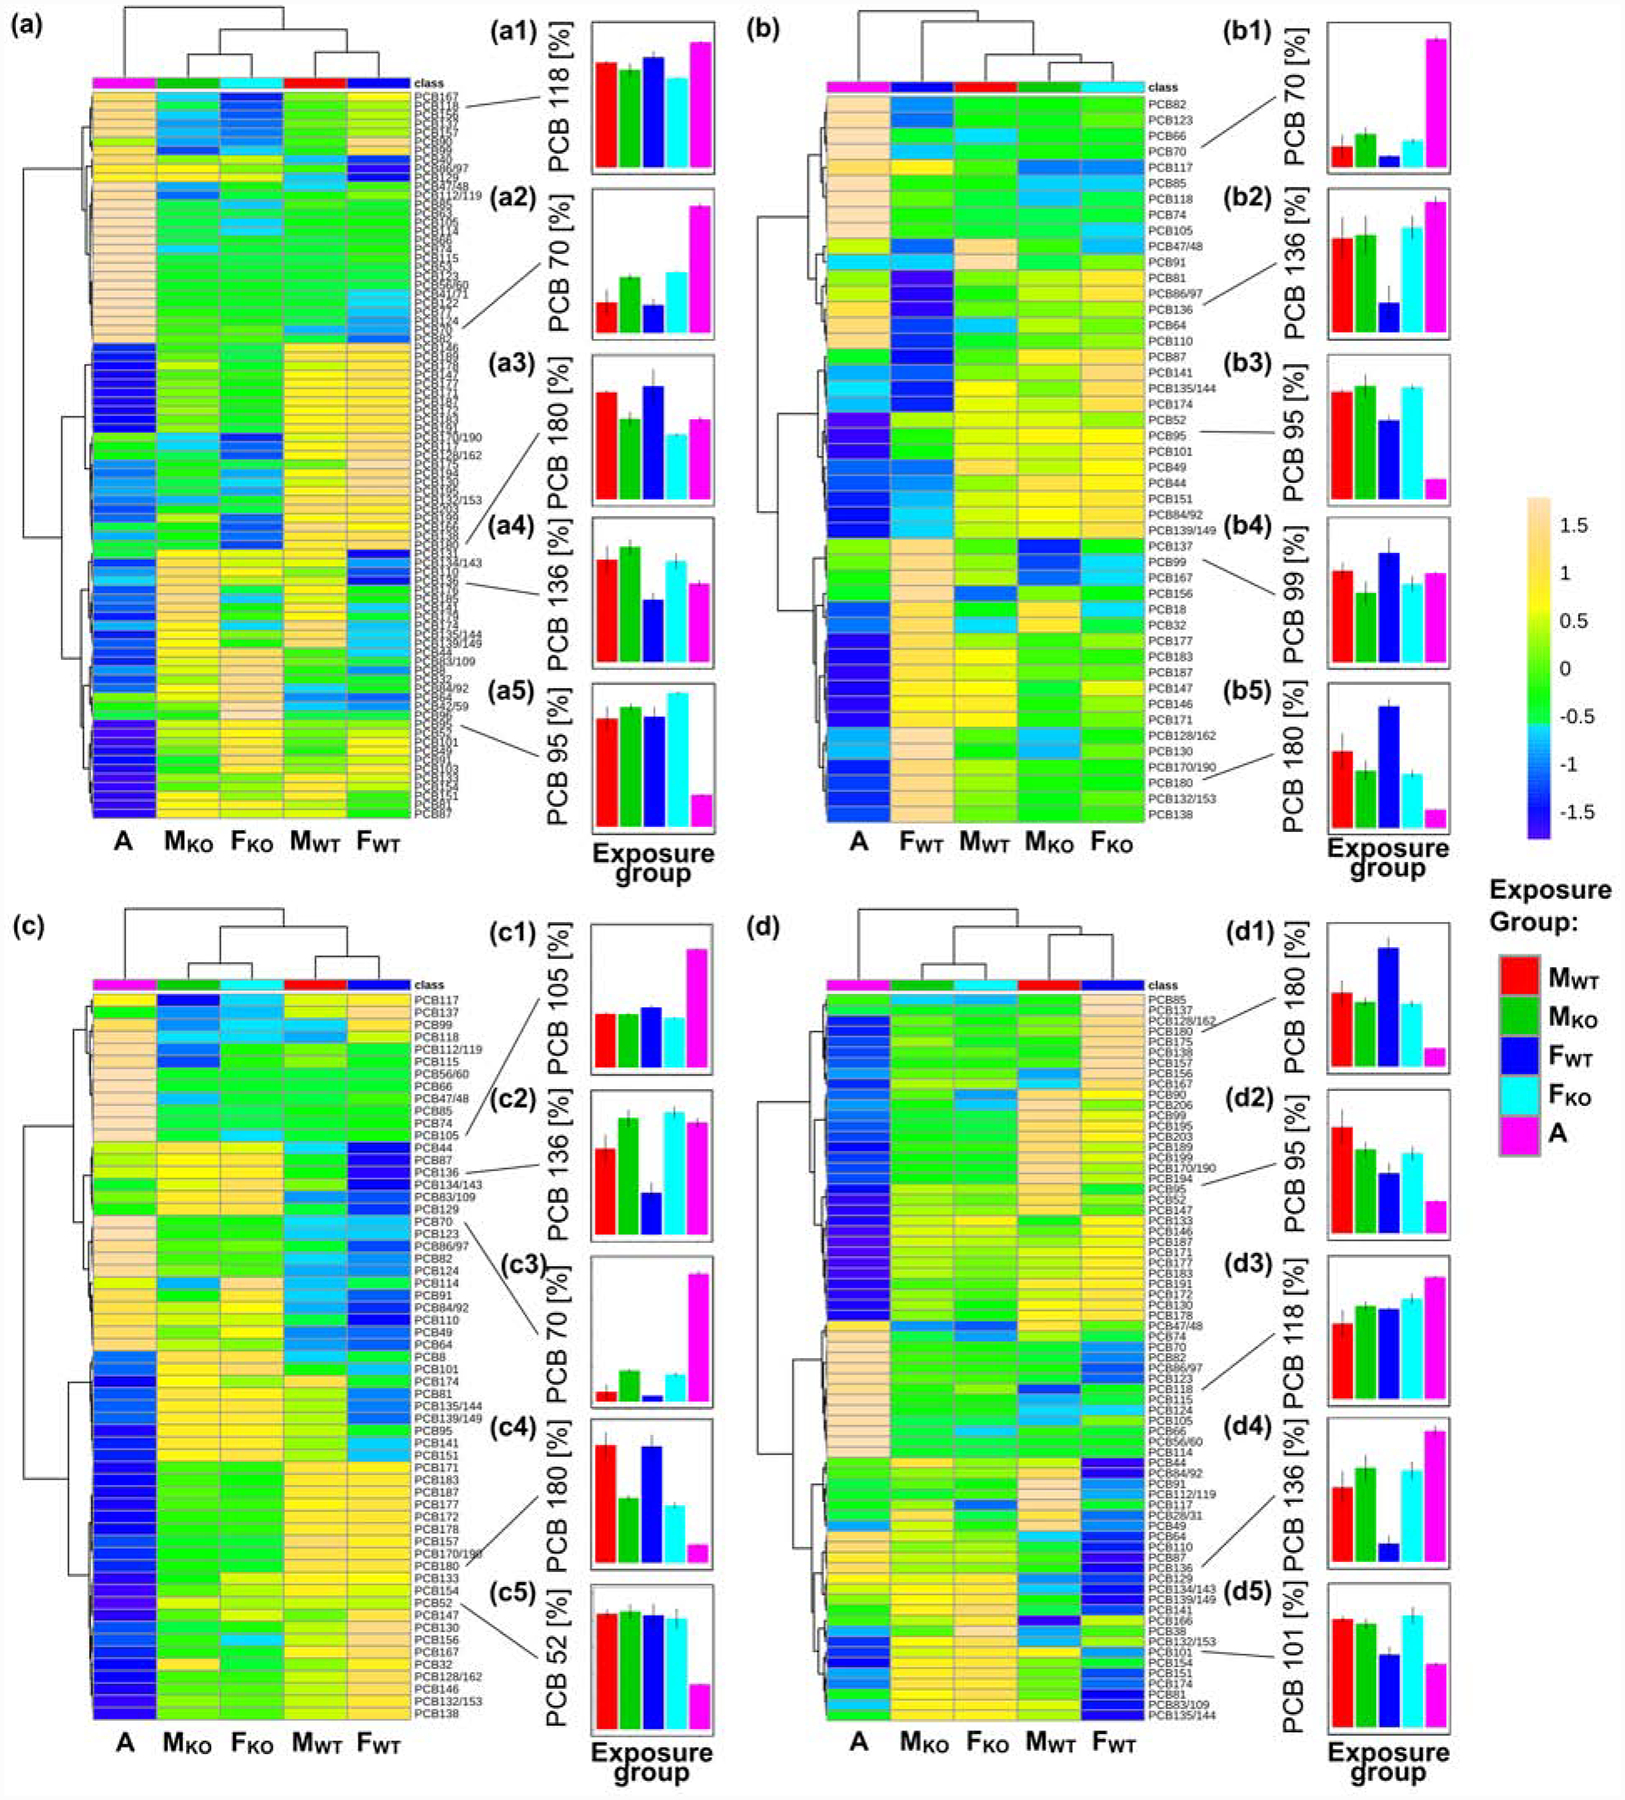
A comparison of the PCB congener profiles in (a) adipose tissue, (b) blood, (c) brain and (d) liver from male wild-type (MWT, n=3), male knockout (MKO, n=5), female wild-type (FWT, n=4), and female knockout (FKO, n=4) mice reveals genotype-dependent differences in the distribution of individual PCB congeners in these tissues. The congener profile of Aroclor 1254 is shown for comparison. The small panels illustrate differences in the mass percentages of representative PCB congeners. These congeners shown here were selected because they illustrate specific differences in the mass composition and, in most cases, are also toxicologically relevant. Heatmaps were generated after removing features with >25% missing values and autoscaling features of the original data using the Heatmap function as implement by MetaboAnalyst 4.0 (Chong et al., 2018). For PCB congener profiles and tissue levels, see the Supplementary material or (Li et al., 2020), respectively. A, Aroclor 1254.