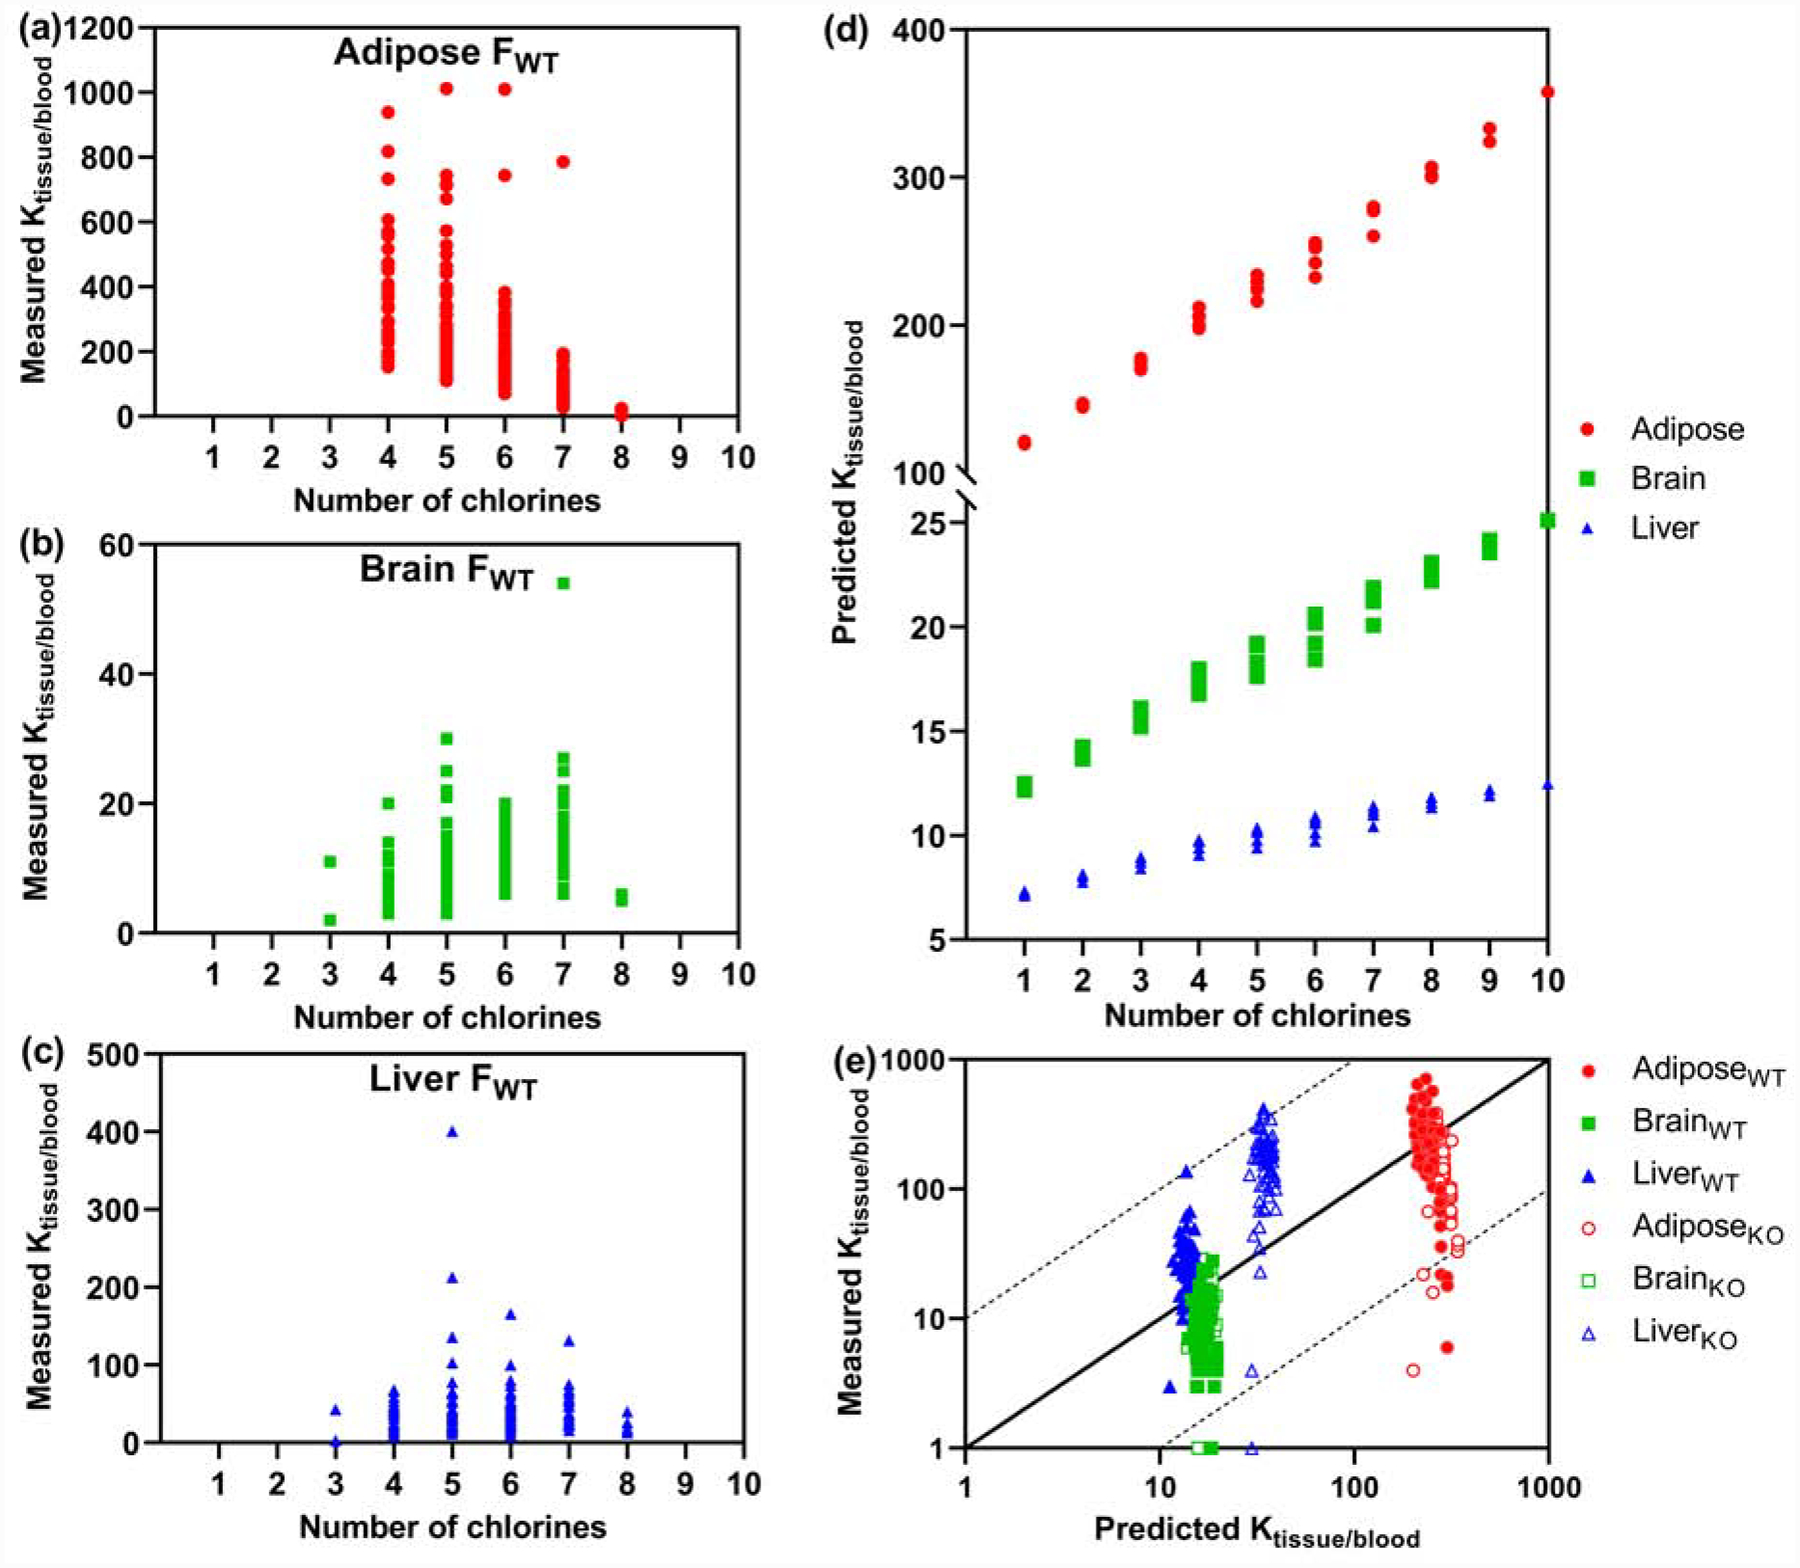
Fig. 4.

Tissue : blood ratios (Ktissue/blood, (ng/g)/(ng/g)) of different PCB homolog groups in female wild type mice (FWT, n=4) show different trends with an increasing degree of chlorination: (a) Adipose : blood ratios decrease, (b) brain : blood ratios increase, and (c) liver : blood ratios of PCBs remain comparable with increasing degree of chlorination. Similar trends were observed with all other exposure groups (Figures S11–S13). (d) In contrast to the experimental findings, predicted tissue : blood ratios (i.e., adipose : blood, brain : blood, and liver : blood ratios) increase with an increasing degree of chlorination. Data for the tissue composition were obtained from the literature (Endo et al., 2013). (e) Despite this discrepancy, the predicted tissue : blood ratios are in reasonable agreement with the experimental values (for the underlying tissue composition data, see Table S3). Each symbol represents the tissue : blood ratio of an individual PCB congener (Li et al., 2020).
