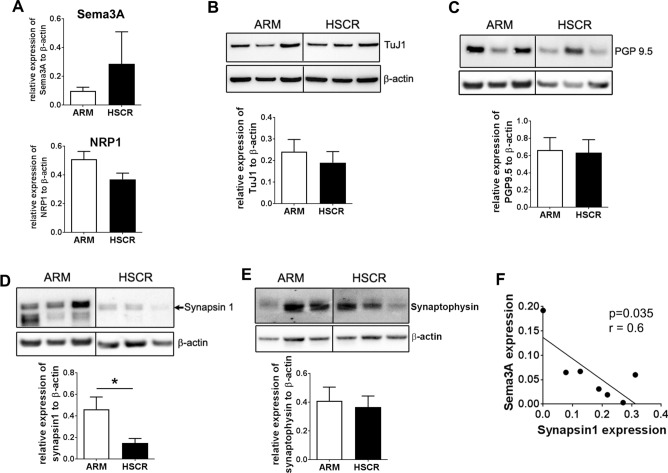
Figure 6.
The reduced level of synapsin 1 in the ganglionic colon of HSCR is inversely correlated with Sema3A expression. (A) Quantification by Western blot of Sema3A and NRP1 protein level normalized to β-actin. Data represent means ± SEM (n = 8–9). (B–D) Western blot of the colon of three representative ARM and HSCR patients with the corresponding quantification for TuJ1 (B), PGP9.5 (C), synapsin 1 (D) and synaptophysin (E). The dividing lines in the Western blot in (B–E) delineate the position of the cropping performed on the same gel before grouping. The full-length blots are presented in Supplementary Information S3. Data represent means ± SEM (n = 8–9). *p = 0.035, Mann–Whitney test. (F) Linear regression analysis between Sema3A and synapsin 1 expression in HSCR colon; p = 0.035, Spearman’s test.

