
Figure 1.
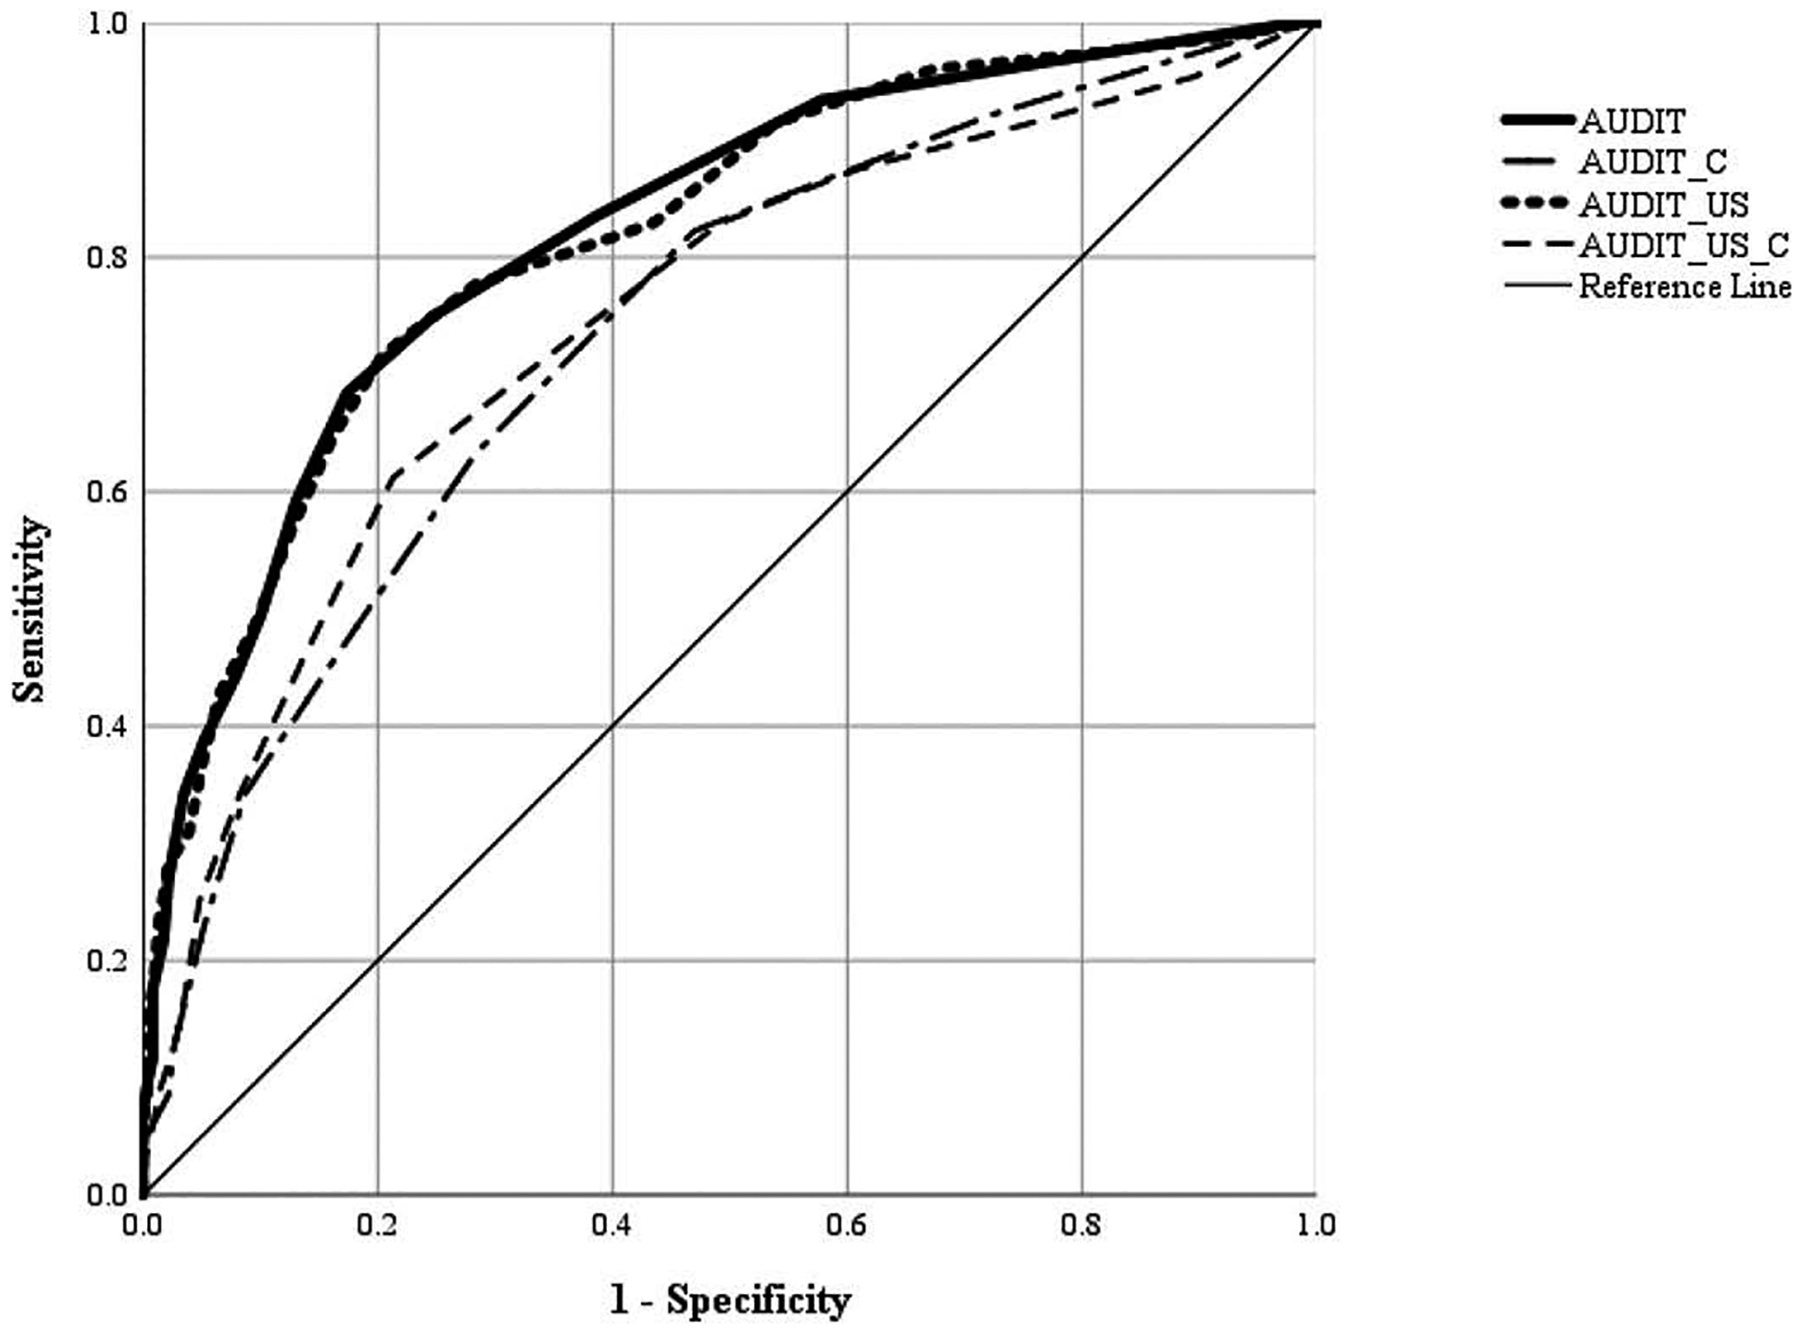
ROC curves of the overall sample with likely AUD on the several AUDIT versions. Points nearest the northwest corner (0,1) of the curve are considered optimal using the J statistic as they maximize sensitivity and minimize 1-specificity. The reference line represents the probability of chance; therefore, curves above the reference line are considered better than chance. The AUC statistic for each curve is calculated as the area between the reference line and the curve itself. Higher AUC statistics indicate better overall tests.