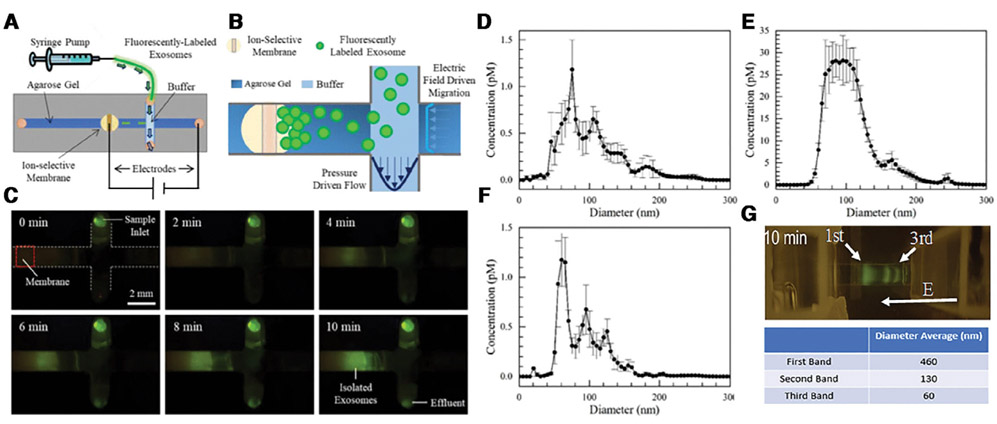
Figure 4.
Schematic of the EV isolation chip (A). A zoom view of the isolated region (B). The pictures of the exosome isolation process with fluorescently labeled exosomes (C). Particle-tracking analysis shows that an optimized 1-step extraction protocol can achieve 70% extraction yield in 10 minutes, based on the particle-tracking analysis of the original suspension (D), the trapped EVs (E), and the flow through (F) (Reproduced from [40] with permission). (G) Preliminary data on chip electrophoretic separation of EVs. Three distinct bands appear, with sizes corresponding to microvesicles, exosomes and lipoproteins (see Fig. 1A). Curiously the mobility is proportional to the size, indicating a significant increase in charge density for larger particles.

