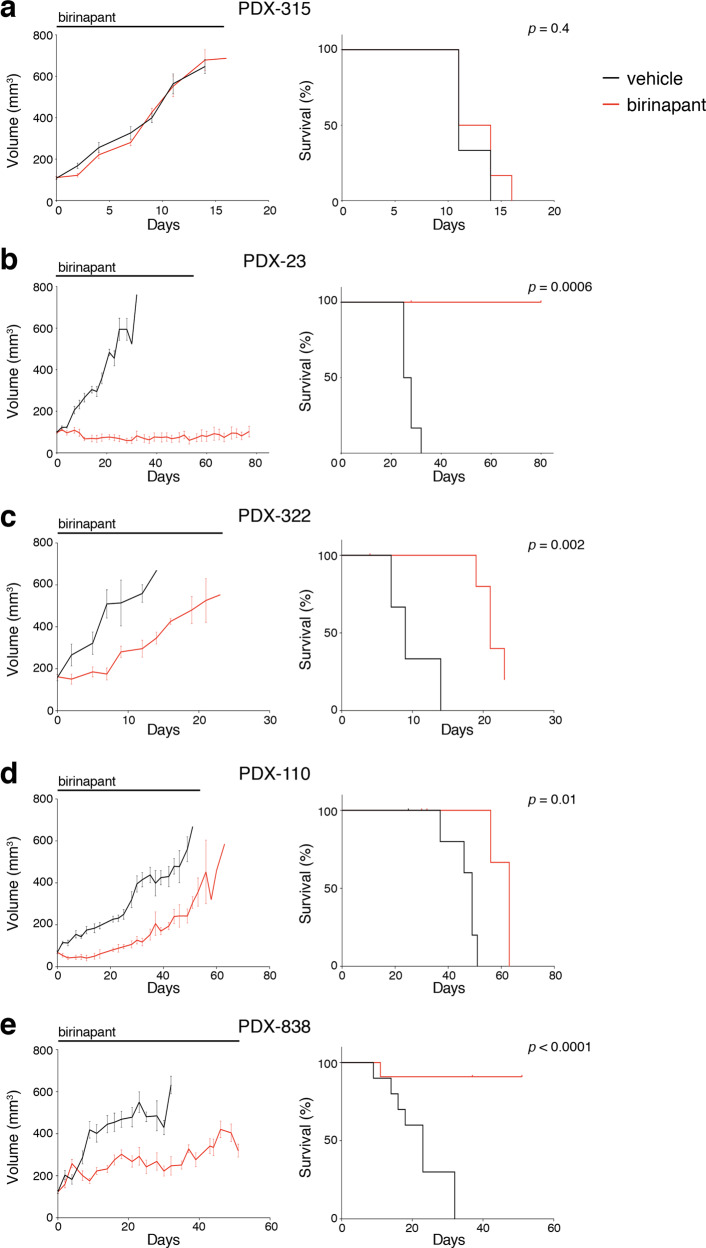
Fig. 2. In vivo efficacy of birinapant in PDX models.
a–e Tumor volume curves (left panels) and Kaplan–Meier survival curves (right panels) for the indicated PDX model (n = 6 to 10 mice per arm). Mice were treated with vehicle alone (black lines) or 30 mg/kg of birinapant (red lines) intraperitoneally three times/week. The treatment time is represented by the gray bars on top of the tumor volume curves. Mice were sacrificed when tumor size reached the experimental ethical end point (>600 mm3). For tumor volume curves, means ± SEM are shown.

