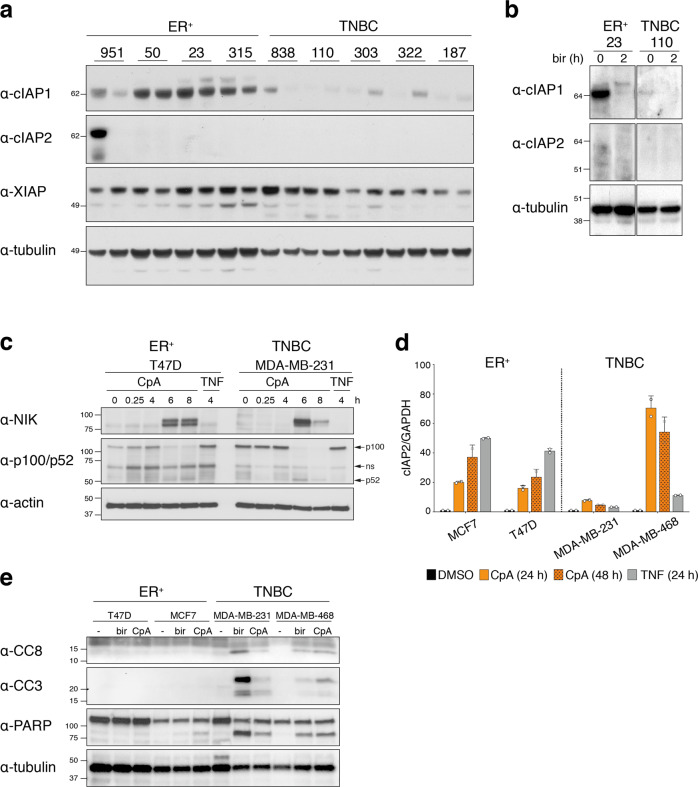
Fig. 3. Differential expression of cIAP1/2 in ER+ and TNBC tumors.
a Western blot analysis of cIAP1, cIAP2, and XIAP protein expression in the indicated ER+ and TNBC PDX models. For each PDX, two lysates from independent mice are represented. b Western blot analysis of cIAP1 and cIAP2 protein expression in lysates from ER+ PDX-23 and TNBC PDX-110 cell suspensions treated with 1 μM of birinapant for 2 h. c Western blot analysis of NIK, p100/p52 protein expression in indicated breast cancer cell lines treated at indicated times with 1 μM of CompA (CpA) or with 100 ng/ml of TNF. d Levels of cIAP2 transcripts relative to GAPDH transcripts in indicated breast cancer cell lines treated with 1 μM of CompA (CpA) for 24 h or 48 h or with 100 ng/ml of TNF for 24 h. The caspase inhibitor IDN-6556 (5 μM) was added in all conditions to inhibit cell death. Bars represent mean ± SD of duplicates of one representative experiment. e Western blot analysis of cleaved caspase-3 (CC3), cleaved caspase-8 (CC8) and PARP in lysates from indicated breast cancer cell lines treated with 1 μM of birinapant (bir) or CompA (CpA) for 24 h. Tubulin (a, b) and actin (c, e) were used as loading controls.

