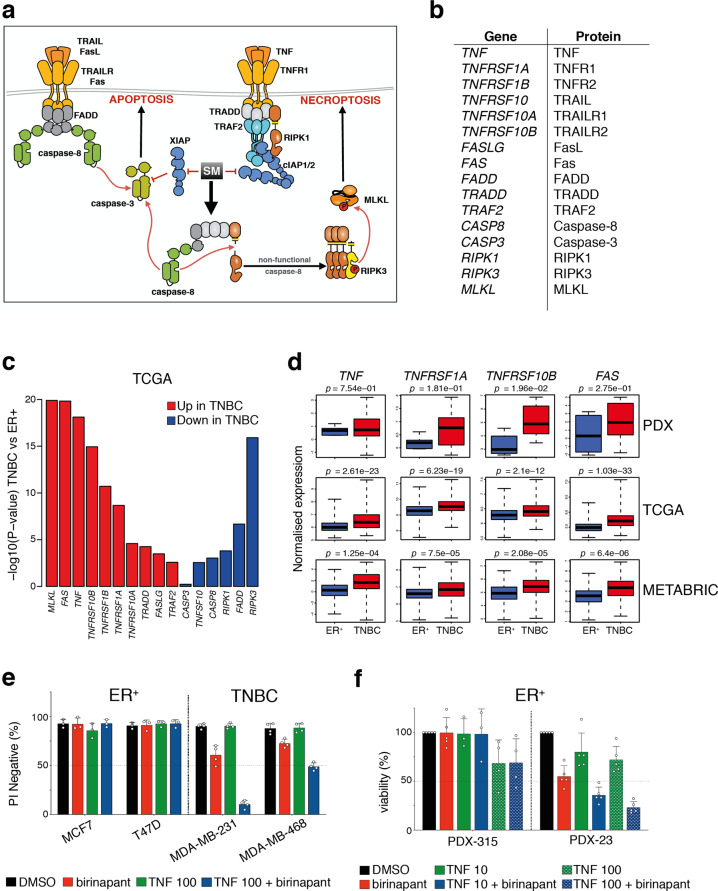
Fig. 4. A gene expression profile that correlates with Smac-mimetic killing of TNBC.
a Schematic of death receptor cell death signaling pathway. Effect of Smac-mimetic (SM)-induced inhibition of IAPs (red inhibitory arrows) and -induced formation of cell death complex (black arrow) are shown. b List of selected genes and their protein names that influence Smac-mimetic-induced cell death. c Most Smac-mimetic killing genes are upregulated in TCGA TNBC samples compared with ER+ cancers (n = 132 for ER+ and n = 183 for TNBC, p = 0.0005) but a minority are downregulated. The plot shows −log10 p value and the direction of change for each gene in TNBC versus ER+ samples. d Box plots representing the expression of indicated genes in PDX models (top panels, n = 3 for ER+ and n = 7 for TNBC PDX models), in TCGA samples (middle panels, n = 132 for ER+ and n = 183 for TNBC samples) and in METABRIC samples (bottom panels, n = 492 for ER+ and n = 331 for TNBC samples). e Cell viability assessed by measurement of PI negative cells by flow cytometry of indicated breast cancer cell lines treated for 24 h with 1 μM of birinapant or 100 ng/ml of TNF or combination of both. Data are means ± SD; n = 2–3 independent experiments. f Cell viability assessed using CellTiter-Glo of ER+ PDX tumor cells treated for 24 h with 1 μM of birinapant or 10 ng/ml or 100 ng/ml of TNF (indicated as TNF 10 or TNF 100, respectively) or combination of birinapant with either TNF concentrations. Data are means ± SD; n = 3–5 independent tumors. e, f Each dot represents either an independent tumor or an independent experiment.

