
Figure 8:
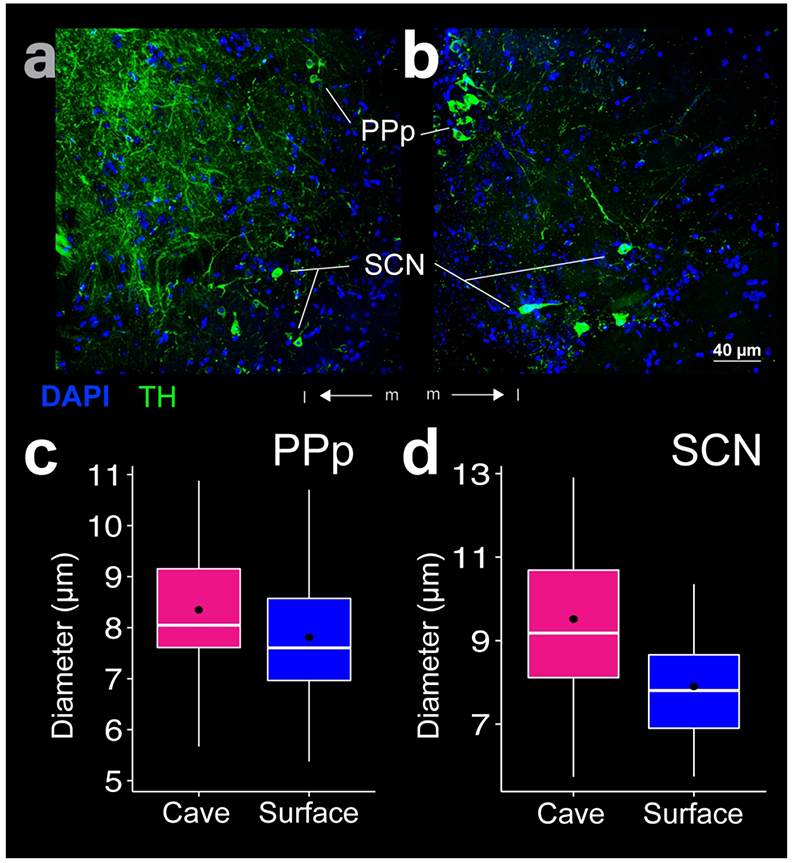
THir labeling in the posterior parvocellular preoptic nucleus (PPp) and suprachiasmatic nucleus (SCN). Images of cave (a) and surface (b) Astyanax show THir (green) and DAPI (blue) immunoreactivity. The box plots (c, d) show that diameters of the THir somata were significantly larger (p < 0.01) in the cave form in both PPp (c) and SCN (d). Black dots are the mean diameter, middle white line is the median, limits of the colored box indicate quartiles, and vertical white lines extend to the minimum and maximum diameters.