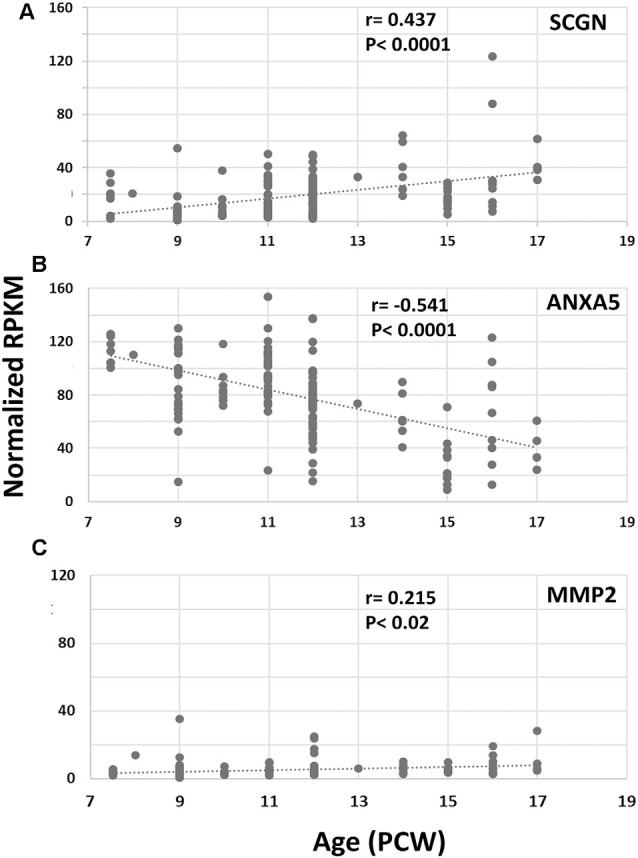
Figure 4.

RNAseq for cortical expression of SCGN, ANXA5 and MMP2, 7.5–17 PCW. Changes of expression (normalized RPKM) with age. SCGN expression showed steady and statistically significant increases with age (A) whereas ANXA5 showed a significant decrease in expression (B). MMP2 was modestly expressed at all ages studied but expression increased to a small but significant degree with age (C). Correlation coefficients (r) and p-values for r (p) are displayed on the charts.
