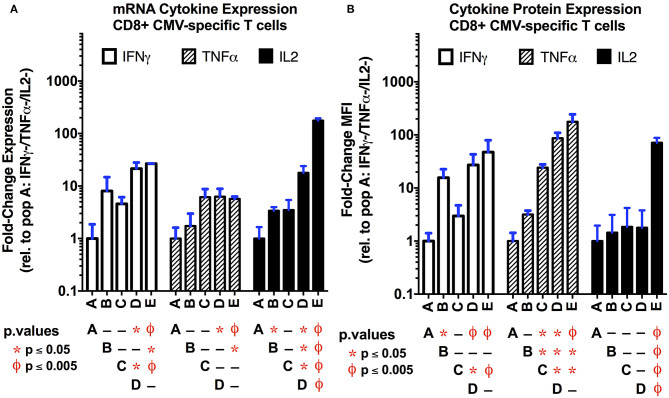
Figure 3.
Comparison of cytokine mRNA (A) and protein (B) expression levels in the functional subsets of CMV-specific CD8+ T cells. The mRNA transcript levels for the three primary type 1 cytokines (IFNγ, TNFα, IL-2) were obtained as normalized counts from total RNAseq data, and expressed as the fold-change (log2) compared to the non-functional population (A; IFNγ-/TNFα-/IL-2-). The protein expression level (B) was obtained by flow cytometry following intracellular staining for the three cytokines of interest. Data are expressed as the fold-change in mean fluorescence intensity (MFI) relative to the non-functional population (n = 3 per subset; error bars represent SD). Overall, there is good correlation between the mRNA and protein expression levels. This suggest that, in single cell experiments, the transcription data may be useful to identify functional subsets. Statistical testing: ϕp < 0.005; *p < 0.05. Populations: (A) non-functional (IFNγ-/TNFα-/IL-2-); (B) IFNγ only/monofunctional (IFNγ+/TNFα-/IL-2-); (C) TNFα monofunctional (IFNγ-/TNFα+/IL-2-); (D) bifunctional (IFNγ+/TNFα+/IL-2-); and (E) polyfunctional (IFNγ+/TNFα+/IL-2+).

