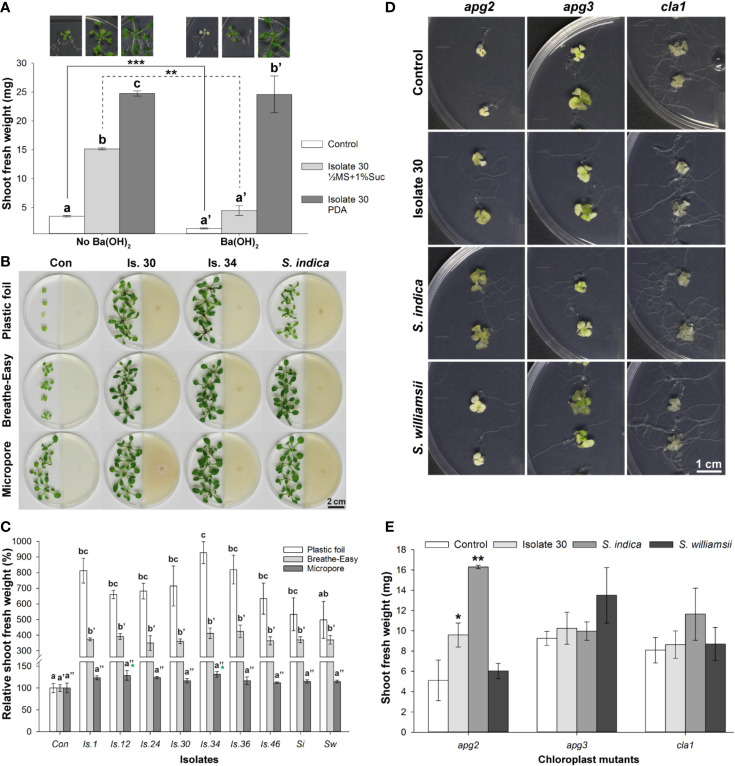
Figure 5.
Volatile assays with Arabidopsis to assess the contribution of Serendipita respiratory CO2 to plant growth stimulation and morphology. (A) Plant growth and mean shoot fresh weight of Col-0 plants grown on ½ MS without sucrose after 8 days of co-cultivation with Serendipita isolate 30 cultured on PDA and on ½ MS with 1% sucrose in Y-plates in the presence and absence of 7 ml 0.1 M Ba(OH)2 as a CO2 trap. Full images of the different tested conditions can be found in Supplementary Figures S12A, B. (B) Arabidopsis plant growth (on ½ MS without sucrose) as observed after 10 days of co-cultivation with Serendipita isolates 30, 34, and S. indica (on PDA) in plates sealed with plastic foil, Breathe-Easy strips and Micropore tape. (C) Comparison of the average relative shoot fresh weight of Arabidopsis plants from plates closed with the sealing tapes from (B). The plastic foil data are derived from four independent experiments with one biological replicate each (see also Supplementary Figure S10), while the Breathe-Easy and Micropore results are based on a single experiment with three biological replicates. (D) Plant growth responses of the chloroplast mutants apg2, apg3, and cla1 grown on ½ MS + 1% sucrose after 14 days of exposure to volatiles from PDA-grown Serendipita isolate 30, S. indica and S. williamsii in I‐plates. Note that not only shoots but also roots in apg2 mutants are better developed under influence of Serendipita volatiles. Photographs of the entire plates are shown in Supplementary Figure S12C. (E) Mean shoot fresh weights corresponding to the treatments presented in (D). Error bars in (A, C, E) indicate standard errors on the mean of three replicates (four in case of plastic foil sealing in C). Asterisks in (A, E) point to significant differences between indicated treatments (A) or compared with the control (E) according to one-sided t-tests (* < 0.05, ** < 0.01, *** < 0.001). Treatments sharing the same letter above their respective bars in (A, C) are not significantly different according to Tukey HSD post hoc tests (α = 0.05). Note that although this test did not detect differences among the isolates in the assay with Micropore tape (C), a one-sided Dunnett’s test on the same data, comparing each treatment specifically with the control, revealed that exposure to VOCs from isolates 12 and 34 did lead to a significantly higher shoot biomass than that recorded for the corresponding control (see green asterisks; * < 0.05). Con, Control; Is., Isolate; MS, Murashige and Skoog medium; PDA, potato dextrose agar; Si, Serendipita indica; Suc, Sucrose; Sw, Serendipita williamsii.

