Figure 6.
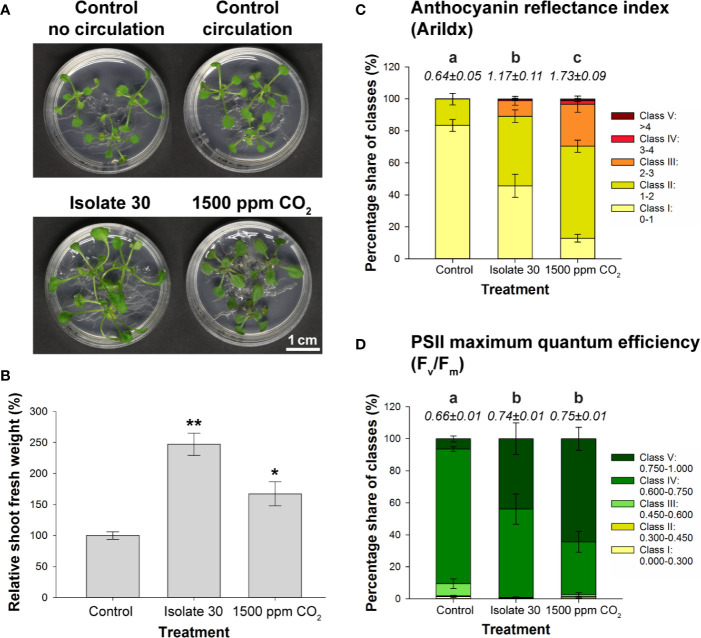
Comparison of the effects of exposure to 1500 ppm CO2 and Serendipita VOCs on Arabidopsis in 4‐L glass reaction vessels. (A) Growth responses in shoots and roots of plants grown on ½ MS without sucrose after a 7-day treatment with either volatiles from PDA-grown isolate 30 or 1500 ppm CO2, as compared to the two control treatments. (B) Average shoot fresh weight of Arabidopsis plants subjected to the above treatments, expressed relative to the control. Asterisks indicate statistically significant differences with the control according to one-sided t-tests (* < 0.05, ** < 0.01). (C, D) Distribution of pixels across different classes of the spectral parameter anthocyanin (AriIdx, C) and of the chlorophyll fluorescence parameter Fv/Fm (D). Average total values of the two parameters (± standard errors) for each of the evaluated treatments are shown above the respective stacked bars. Treatments sharing the same letter do not exhibit statistically significant differences according to Tukey HSD post hoc tests (α = 0.05). For a visualization of the pixel distribution across the different classes in the shoots, see Supplementary Figure S14B. Graphical data for chlorophyll content (ChlIdx) are presented in Supplementary Figure S14C. Error bars in all displayed graphs indicate standard errors on the mean of three replicates with each replicate representing three plants (each vessel contained three Petri plates, which were considered as internal biological replicates). When we refer to “Control,” the data from the control vessel with air circulation are shown (does not differ from the control without circulation; see A).

