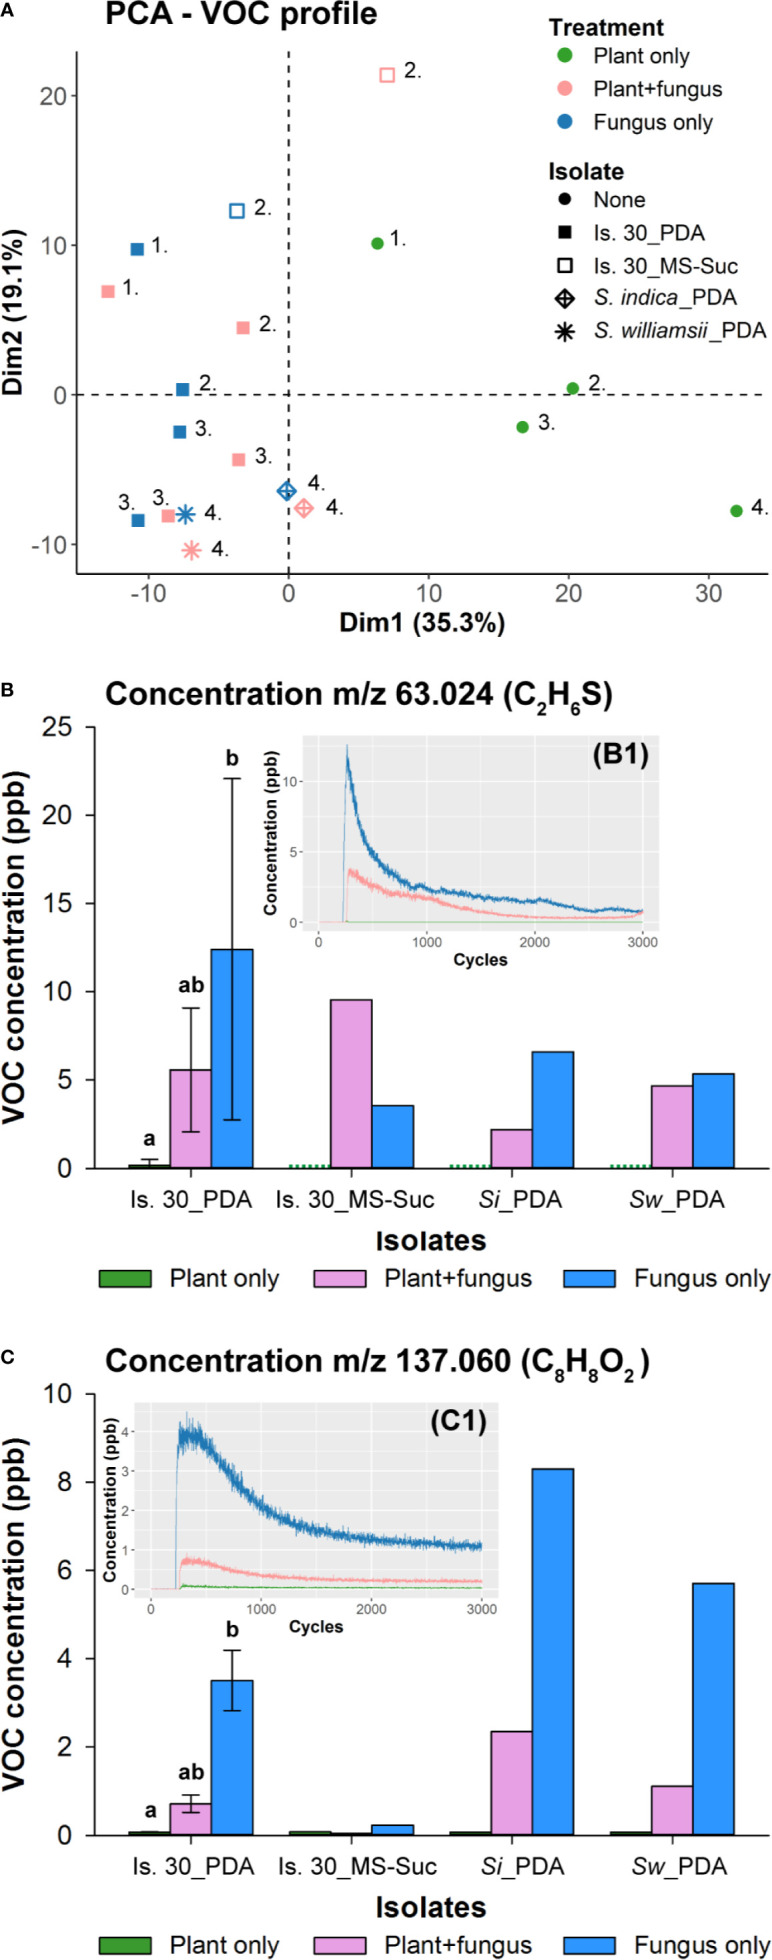
Figure 7.

Determination of Serendipita volatile profiles by direct headspace analysis using PTR-TOF-MS. (A) PCA plot visualizing general differences in the samples’ volatile profile as measured after 4 days of (co-)cultivation via PTR-TOF-MS. Color codes indicate whether the vessel contained either Arabidopsis cultures (green; grown on ½ MS without sucrose), fungal cultures (blue; isolate 30 cultured on either PDA or ½ MS without sucrose, S. indica on PDA, or S. williamsii on PDA) or both of them adjacent to each other (pink). Symbols refer to the different fungal strains and medium conditions tested. Numbers signify which samples were analyzed on the same day. The position of the samples in the reduced ordination space reveals that neither the two fungal conditions evaluated per isolate (co-cultivated with Arabidopsis or not) nor the three Serendipita isolates studied here can be distinguished based on their volatile profiles. The only exception to this general observation is isolate 30 cultured on ½ MS without sucrose: the VOC composition of this culture is different from that of the PDA cultures and appears to be modified in the presence of plants. (B, C) Concentrations of the two compounds that were most abundant in the headspace of the Serendipita cultures. These VOCs were detected at m/z ratios 63.024 (B) and 137.060 (C) during PTR-TOF-MS analysis, corresponding to DMS (C2H6S) and methyl benzoate (C8H8O2), respectively. Color codes are the same as in (A). The green dots for the plant controls in (B) stand for a concentration of 0 ppb. Experiments with isolate 30 on PDA were set up on three different days. Error bars represent standard deviations; treatments sharing the same letter above their respective bars are not significantly different according to a Dunn’s test adjusted for multiple comparisons (Bonferroni correction; α = 0.05). S. indica and S. williamsii (and isolate 30 on ½ MS) were evaluated in a single experiment (no error bars or statistics). The inset graphs (B1 and C1) show that the recorded concentration decreases over the time span of the sample measurement (2700 cycles or 45 min), resulting in a clear decay pattern. For each individual analysis, only the signals from 60 consecutive cycles at the beginning of the measurement were used to calculate an average concentration per compound. Is., Isolate; MS, ½ Murashige and Skoog medium; PDA, potato dextrose agar; Si, Serendipita indica; Suc, Sucrose; Sw, Serendipita williamsii.
