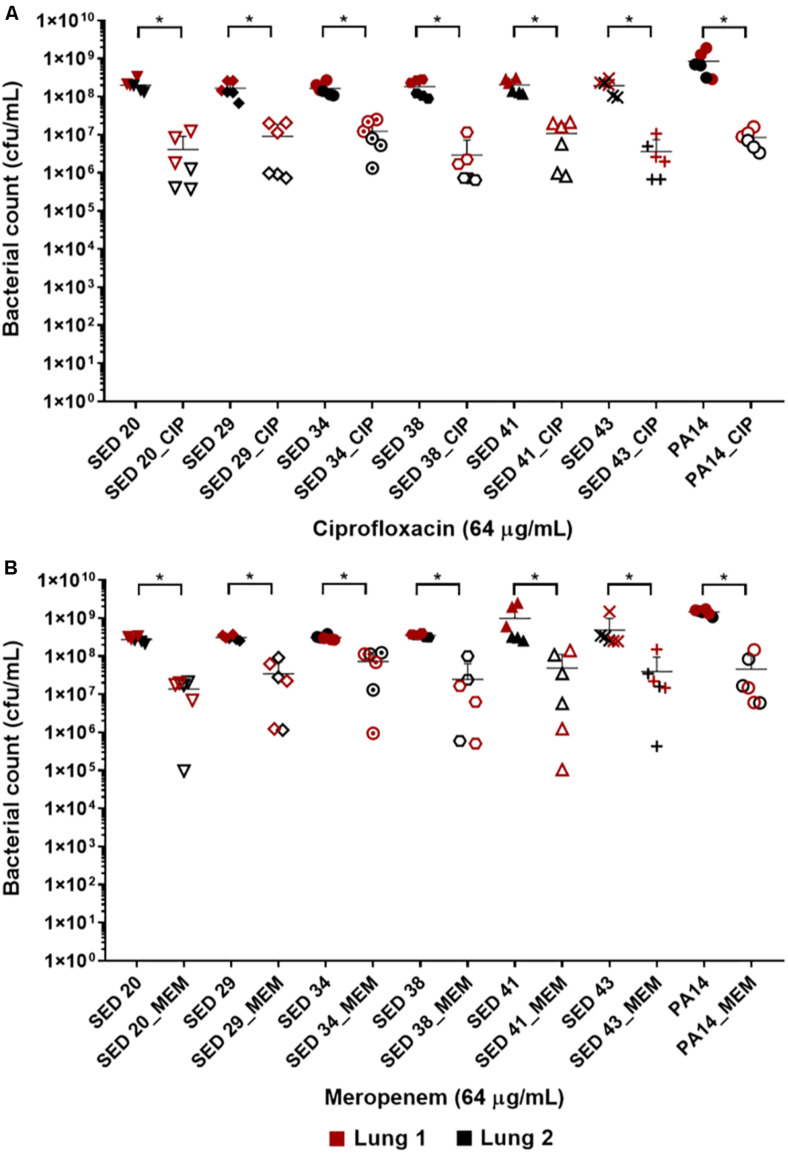
FIGURE 2.
Bacterial load of P. aeruginosa in the EVPL biofilm model with and without exposure to (A) ciprofloxacin (CIP), (B) meropenem (MEM) 64 (μg/mL). The data in red and black represents two independent lungs where closed data points are for untreated bacterial strains and open data points are for antibiotic treated. Error bars are means ± SD, some error bars are too small to be visible on the graph. Unpaired t-tests were performed for the pairwise statistical analysis of treated against untreated bacterial biofilm load for each strain; significant difference (p value < 0.05) are denoted with *.

