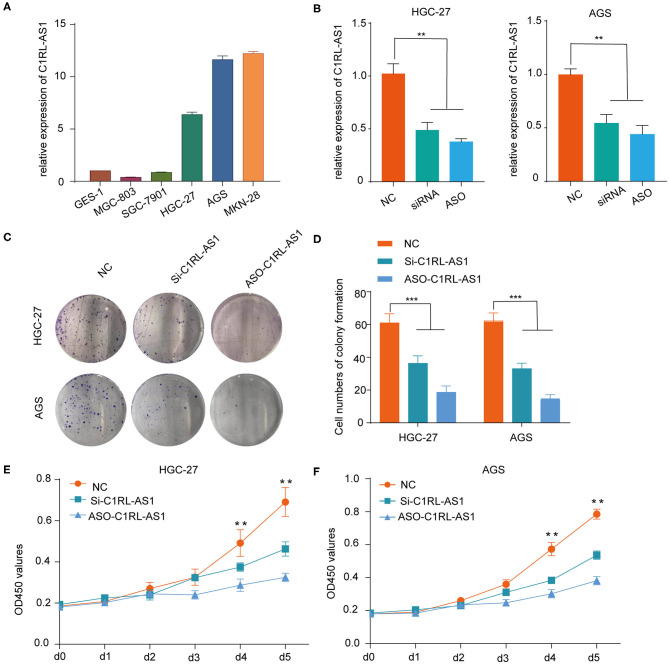
Figure 3.
(A) Various levels of C1RL-AS1 expression in gastric cancer cell lines. (B) The silencing efficacy of siRNA and ASOs in HGC-27 and AGS cells was detected by qPCR. (C,D) Colony formation assays with representative images of HGC-27 and AGS cells after transfection with lncRNA C1RL-AS1 siRNA and ASO. (E,F) CCK-8 assays of HGC-27 and AGS cells after inhibiting C1RL-AS1 expression with siRNA and ASOs. Data are shown as the mean ± SEM, n = 3. *p < 0.05, **p < 0.01, ***p < 0.001.

