
Figure 3.
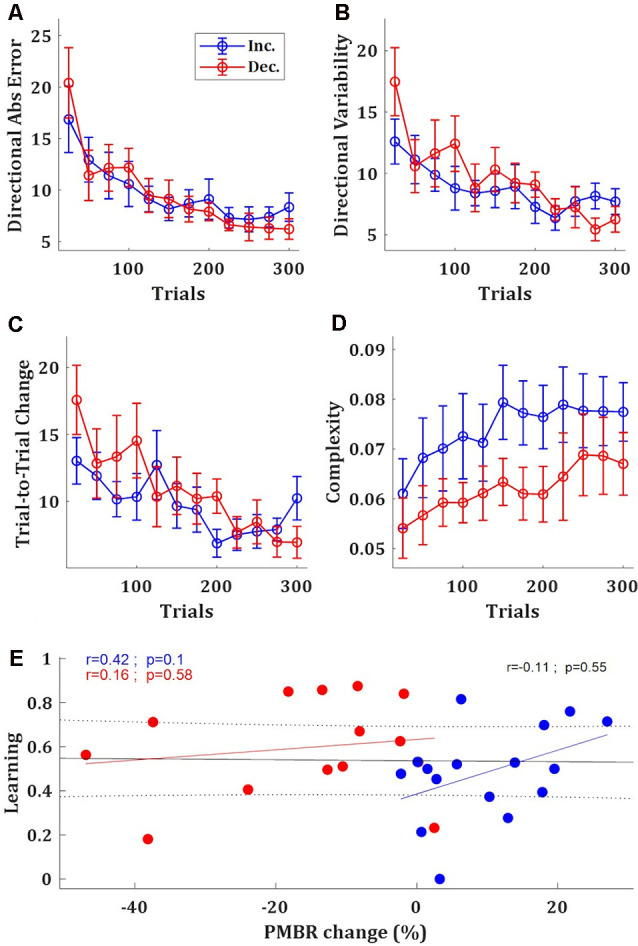
Behavioral differences between the groups. (A–D) Directional absolute error (A), directional variability (B), trial-to-trial directional change (C), and manipulative complexity (D) of the PMBR Increasers (blue) and PMBR Decreasers (red) over blocks of 25 trials, averaged across all subjects in each group, error bars represent SEM. (E) Correlations between the PMBR change [from the first block (trials 1–25) to the learning plateau (trials 201–300)] and the learning, across all subjects (black line) and within each group.