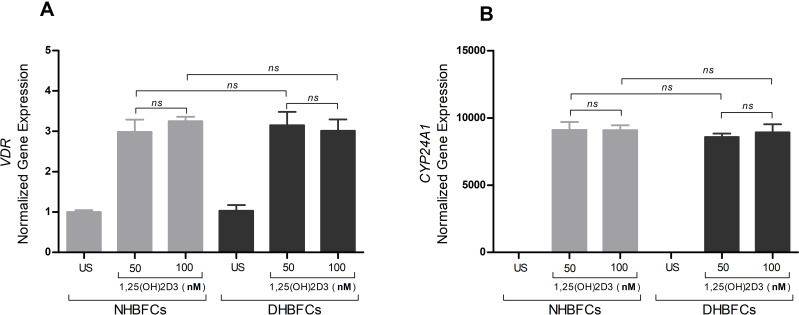
Figure 1.
mRNA expression of VDR (A) and CYP24A1 (B) in NHBFCs or DHBFCs as a response to 1,25(OH)2D3 (50 nM or 100 nM) treatment. Student t-test was applied to compare the fold change difference in mRNA expression between two experimental conditions and associated p- values are indicated. (ns) p > 0.05, no significant difference in mean fold change mRNA expression. Data were expressed as mean ± standard error (SE) from duplicate values of two independent experiments. NHBFCs (n=4), DHBFCs (n=4).

