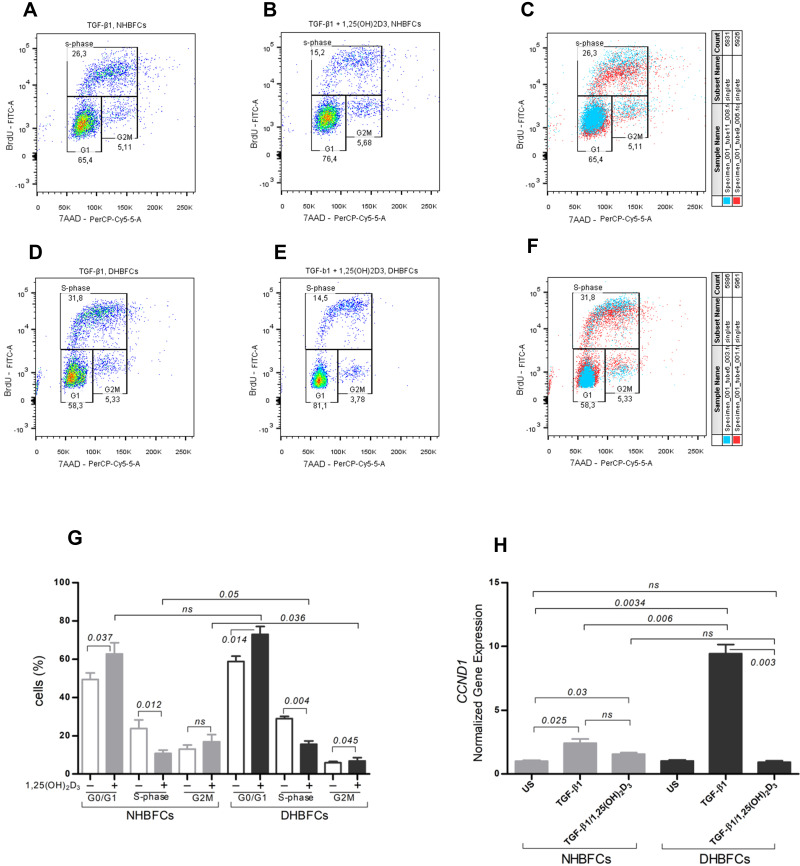
Figure 4.
Effect of 1,25(OH)2D3 (50 nM) on HBFCs proliferation using flow cytometry (A–G). HBFCs have been measured for 7AAD or BrdU content and were assigned to the G0/G1, S or G2/M phases by drawing gates, as demonstrated in each panel: TGF-β1-treated NHBFCs (A), 1,25(OH)2D3-TGF-β1-treated NHBFCs (B), TGF-β1-treated NHBFCs vs 1,25(OH)2D3-TGF-β1-treated NHBFCs, overlapped data (C), TGF-β1-treated DHBFCs (D), 1,25(OH)2D3-TGF-β1-treated DHBFCs (E), TGF-β1-treated DHBFCs vs 1,25(OH)2D3-TGF-β1-treated DHBFCs, overlapped data (F). The percentage of cells in each gate represents the relative number of NHBFCs or DHBFCs in G0/G1, S, and G2/M. (G) Graphic quantitation of the respective cell cycle phases using GraphPad. (H) mRNA expression of CCND1 in TGF-β1-induced-DHBFCs or NHBFCs in response to 1,25(OH)2D3 (50 nM) treatment. The Student’s t-test (variances assumed equally by ANOVA) was used to determine the difference between NHBFCs and DHBFCs under a given treatment and associated p- values are indicated. (ns) p > 0.05, no significant difference. Data were expressed as mean ± standard error (SE) from duplicate values of two independent experiments. NHBFCs (n=4), DHBFCs (n=4).

