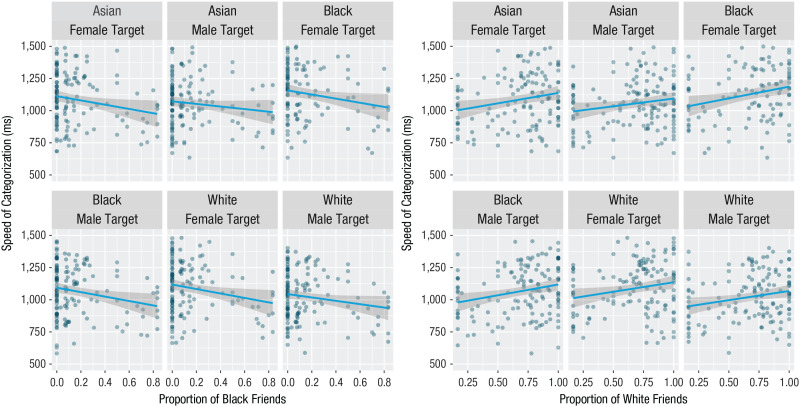
Fig. 8.
Correlations between categorization speed and the proportion of children’s friends who are Black (left panel) and White (right panel; omnibus analysis). Results are shown separately for each combination of target race and gender. Lines indicate best-fitting regressions, and shaded regions are 95% confidence bands.

