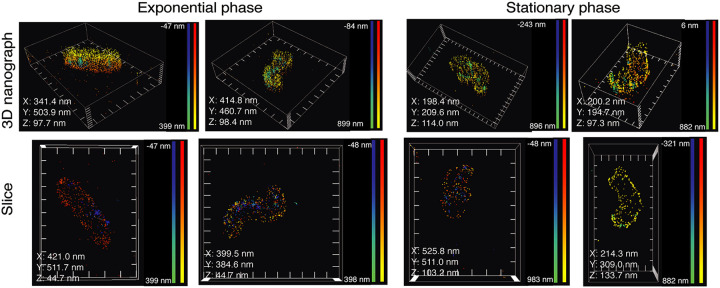
FIG 5.
Visualization of the foci of RNase J-GFP in exponential and stationary phase by dSTORM superresolution microscopy. Representative single-molecule localization microscopy images show the membrane of H. pylori as visualized after labeling with WGA-AF555 (yellow-red) and the RNase J-GFP foci after labeling with anti-GFP-Cy5 nanobodies (blue-green). The upper panels show the full 3D volume of representative cells, and the lower panels show a 2D longitudinal slice of the bacteria. The X, Y, and Z values in each image indicate the distance between the ticks of the respective axes in the picture. The color gradients red-yellow (for WGA-AF555) and blue-green (for anti-GFP-Cy5 nanobodies) indicate the distance for each dot with respect to the coverslip, as indicated in the corresponding scale bars in each panel. The experiment was performed 3 times.

