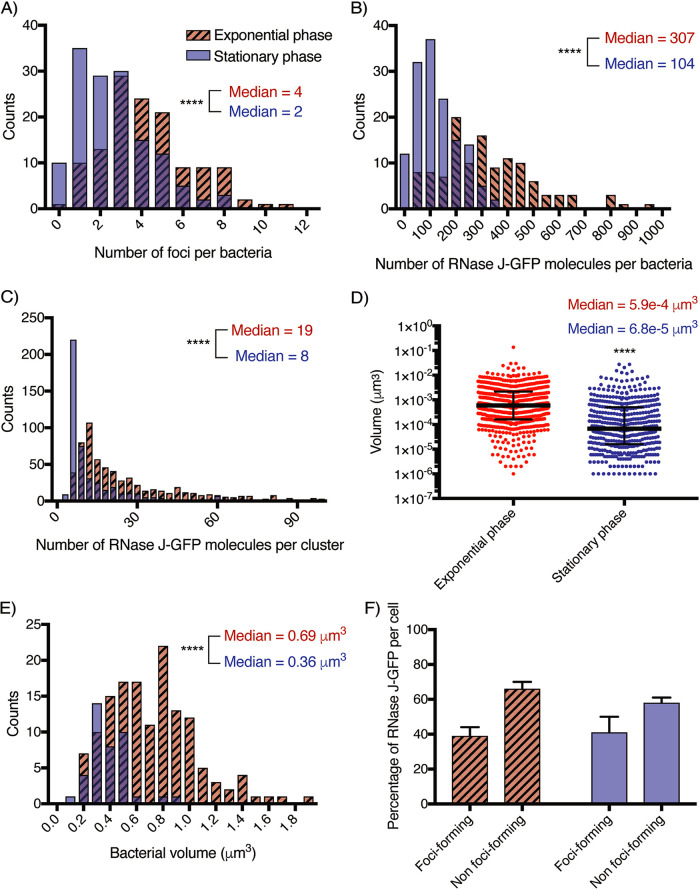
FIG 6.
dSTORM quantification of the RNase J-GFP foci of H. pylori cells in exponential phase (red hatched bars) and stationary phase (blue bars). The experiment was carried out 3 times, and the data correspond to the results presented in Fig. 5. (A) Distribution histogram of the amount of foci per cell in exponential-phase cells (n = 121 cells) and stationary-phase cells (n = 191 cells). Median values determined under both conditions are indicated. (B) Distribution histogram of the number of RNase J-GFP molecules per cell in exponential-phase and stationary-phase cells. Median values determined under both conditions are indicated. (C) Distribution histogram of the number of RNase J-GFP molecules per cluster in exponential-phase and stationary-phase cells (n = 535 clusters in exponential phase and n = 371 clusters in stationary phase). Median values determined under both conditions are indicated. (D) Distribution histogram of the volume of the RNase J-GFP clusters in exponential-phase and stationary-phase cells. Median values determined under both conditions are indicated. (E) Distribution histogram of the volume of H. pylori cells in exponential phase (n = 142 cells) and stationary phase (n = 40 cells). ****, P < 0.0001 (for panels A to E). (F) Bar graph of the proportions of focus-forming and non-focus-forming RNase J-GFP molecules calculated on the basis of mean values in exponential-phase and stationary-phase cells.

