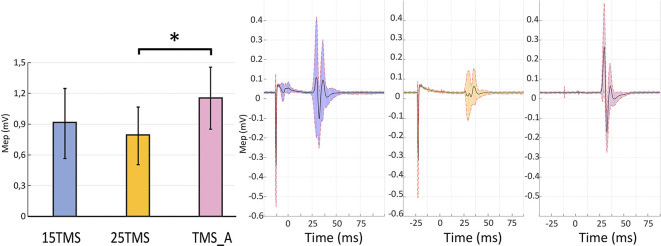
Figure 2.
Short-latency afferent inhibition. The left panel presents motor evoked potential (MEP) amplitudes recorded in the three conditions containing TMS stimulations ±SEM: MNS + TMS (15 ms; blue), MNS + TMS (25 ms; yellow), and TMS_A (violet). An asterisk (*) on the top of two bars highlights a significant difference (permutation test; p < 0.05). The right panel shows the average MEP and standard deviation of the opponens pollicis (OP) muscular activity in a representative subject in each of the three conditions containing TMS.

