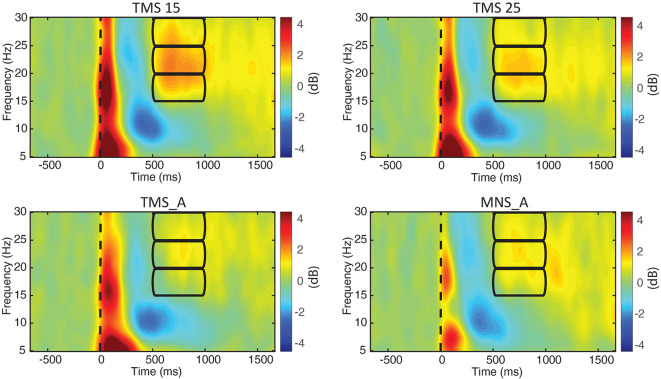
Figure 4.
ERSPs for electrode C3. The power spectra between 5 and 30 Hz are shown for all experimental conditions (upper left: MNS + TMS15, upper right: MNS + TMS25, lower left: TMS_A, and lower right: MNS_A). Frequency bands (lower, middle, and upper beta) and time window of interest (from 500 to 1,000 ms; used thereafter for statistical comparisons) are represented by three rectangles.

