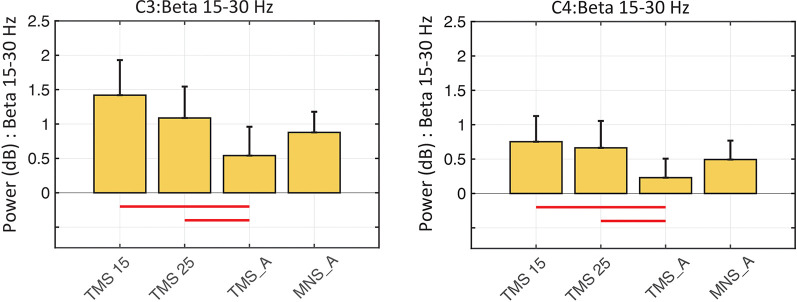
Figure 5.
Beta rebound statistics in C3 and C4 (mean ± SEM). The histograms show the beta power rebound in a 500-ms window (from 500 to 1,000 ms) across the four experimental conditions in the C3 (left panel) and C4 (right panel) electrodes. Red horizontal lines represent significant differences between conditions (p < 0.05).

