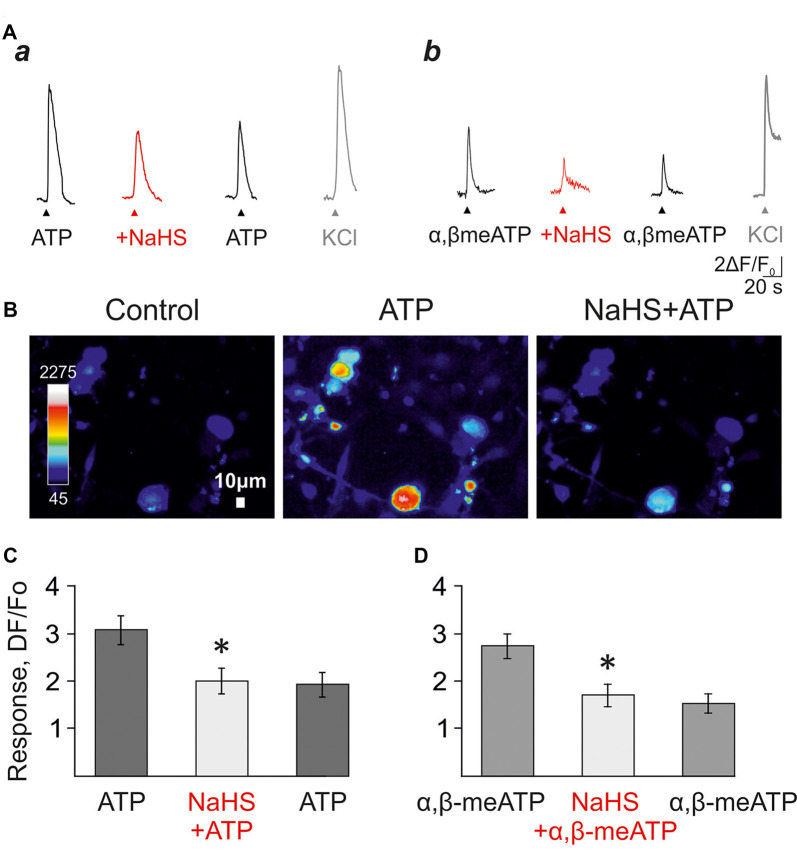
Figure 3.
The effect of NaHS on ATP-induced calcium signals in isolated trigeminal neurons. (A) Examples of calcium signals induced by application of 100 μM ATP (a), or 20 μM α,β-meATP (b) in control, and in the presence of 100 μM NaHS. KCl was applied to distinguish neurons from trigeminal glial cells. (B) Pseudo-color images showing ATP-induced calcium signals in control and after the preliminary application of NaHS. (C) Histograms showing the amplitudes of calcium signals in response to the application of ATP (100 μM) in control, and in the presence of NaHS (n = 66 cells). (D) Histograms showing the amplitudes of calcium signals in response to applications of α,β-meATP (20 μM) in control, and in the presence of NaHS (n = 27 cells). *p < 0.05.

