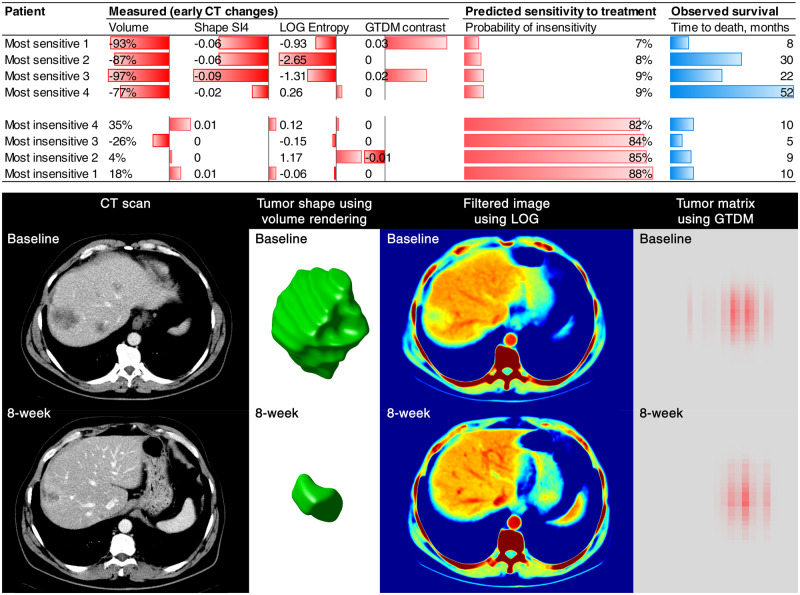
Figure 3.
Visual representation of the four imaging features included in the signature. The changes in the radiomics features in the patients with the lowest and the highest probability of insensitivity to treatment according to the radiomics signature are presented on this graph (most sensitive 1–4 vs most insensitive 1–4). The changes in tumor imaging phenotype of the patient “most sensitive 1” is displayed below. As demonstrated, CT-scan images are transformed to other mathematical spaces for feature extraction, for example, CT image is transformed to LOG space for computing the entropy value (spatial heterogeneity), and tumor pixels within segmentation contour are transformed to GTDM matrix for computing the contrast value.

