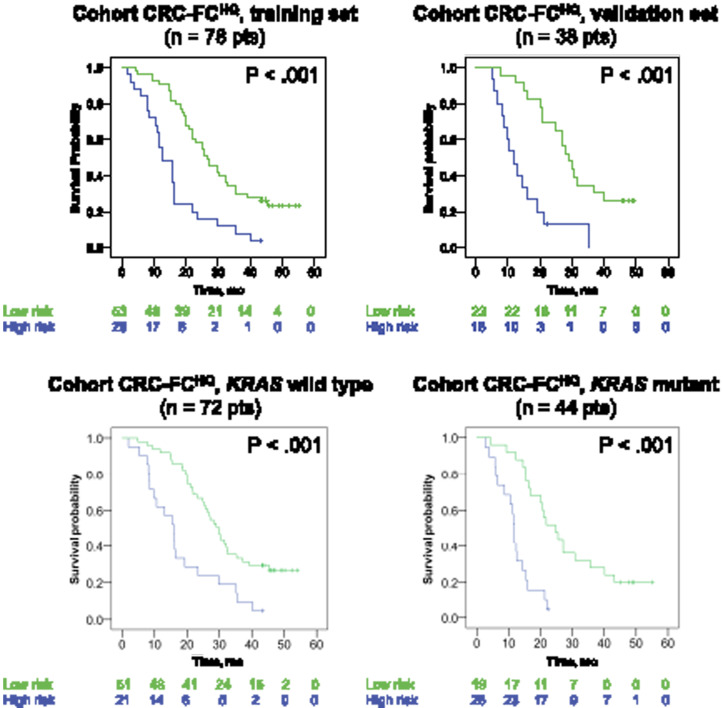
Figure 4.
Risk stratification using the signature in the discovery cohort. The discovery cohort included mCRC patients treated with FOLFIRI+ cetuximab. Kaplan-Meier graphs depicting overall survival in patients stratified at high-risk (signature >0.5) or low-risk (signature ≤0.5) at 8 weeks by the signature. P values are based on dataset-stratified two-sided log-rank tests. A, B) Survival probability in the training and in the validation sets. C, D) Survival probability in KRAS wild-type and KRAS mutant groups. CRC = colorectal cancer; F = FOLFIRI; FC = FOLFIRI+cetuximab; HQ= High computed tomography quality; SD = Standard computed tomography quality.

